Monitoring
Overview
This document provides instructions on how to access and use the monitoring system implemented for the self-hosted Appcircle server.
The monitoring system is designed to provide visibility into the application logs, enabling you to troubleshoot issues, monitor performance, and gain insights into the application's behavior.
The subsequent sections of this document will guide you through the process of accessing the Grafana web interface, navigating the log data.
To access and use the monitoring capabilities, you must be running Appcircle server version 3.15.0 or later.
The log monitoring system is for viewing the logs of the running Appcircle Server services. If you are having issues about starting the Appcircle Server services, you should use other CLI tools for troubleshooting and resolving the issues.
You may not access to the monitoring UI if services are not running healthy.
Accessing to Grafana Web UI
The spacetech in the example codes below are example project name.
Please find your own project name and replace spacetech with your project name.
To see projects, you can check the projects directory.
ls -l ./projects
We will use .appcircle.spacetech.com example URLs below. You should change this domain with your own Appcircle domain.
The Grafana monitoring UI is accessible by default through the monitor subdomain. In our example, the full domain URL is monitor.appcircle.spacetech.com.
You can face SSL errors while connecting to the monitor URL like ERR_CERT_COMMON_NAME_INVALID. That error indicates the SSL certificate of the Appcircle server doesn't include the monitor subdomain.
The recommended solution is to update the SSL certificate of the Appcircle server.
Upon navigating to the Grafana login page, you should authenticate using the initial username and password specified in the global.yaml file of your project. To verify these credentials, you can execute the following command on the Appcircle server:
Change directory to Appcircle server.
cd appcircle-server
- Update the environment variable
PATHwith the required dependencies.
export PATH=$PATH:$(pwd)/deps/bin
Print the Keycloak authentication credentials.
yq '.keycloak.initialUsername' ./projects/spacetech/export/.global.yaml && \
yq '.keycloak.initialPassword' ./projects/spacetech/export/.global.yaml
The example output below displays the initialUsername on the first line and initialPassword on the second line. These credentials serve as your login information for the Grafana monitoring interface.
admin@spacetech.com
SuperSecretPassword
Retention Period of Logs
Retention period refers to the duration for which log data is stored before being deleted or archived. It's used to manage storage space, optimize system performance, and ensure compliance with regulatory requirements.
Retention Period on Loki
The Appcircle server logs will be stored in the Loki. So the queries and filters that you run from the Grafana UI will run on the Loki side.
The logs in the loki should be cleaned automatically. By default, the retention period for the Appcircle server logs on the Loki side are 720 hours (30 days).
If you want to change this, you can edit the global.yaml of your project.
Be aware that this process will cause downtime since it requires a restart of the Appcircle server.
vi ./projects/spacetech/global.yaml
Add or change the retention period variable.
loki:
  retentionPeriod: 168h # 7 days
- Shutdown Appcircle server.
./ac-self-hosted.sh -n "spacetech" down
- Apply configuration changes.
./ac-self-hosted.sh -n "spacetech" export
- Boot Appcircle server.
./ac-self-hosted.sh -n "spacetech" up
You should check the status of the Appcircle server after boot for any possible errors.
./ac-self-hosted.sh -n "spacetech" check
Retention on Systemd
The Appcircle server and other system services also transmit their logs to the Journald log driver. However, once Appcircle server logs are successfully forwarded to Loki, the local server logs become redundant and can be safely deleted.
If you wish to configure a maximum size limit for automatic log deletion on the Journald, you can modify the relevant configuration settings.
Modifying the Journald configuration requires elevated privileges with sudo permissions, as it involves altering system-level settings.
Edit the Journald config file.
sudo vi /etc/systemd/journald.conf
Uncomment or add the SystemMaxUse variable in the configuration file and assign it the desired value, such as 200M for a 200 megabyte limit.
SystemMaxUse=200M
Restart the Systemd journal service to apply the changes.
sudo systemctl restart systemd-journald
With this configuration change, the Journald log driver will now utilize a maximum of 200 megabytes of disk space for storing logs.
Filtering Logs
After successfully authenticating with the Grafana user interface, you can commence filtering and exploring log data by navigating to the "Explore" menu.
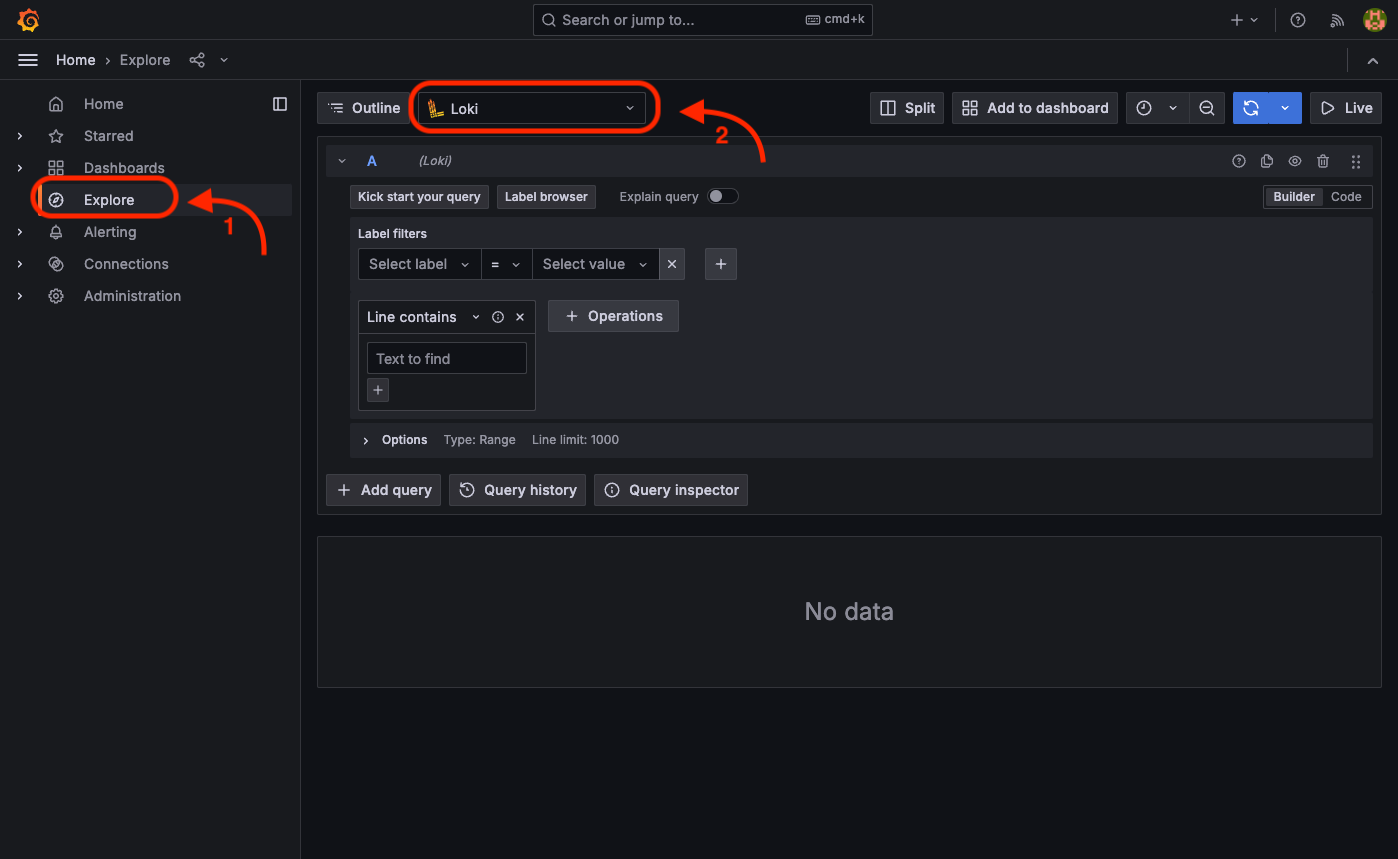
To filter and view logs for a specific service, follow the steps outlined below. For instance, if you wish to examine the log entries pertaining to the build service:
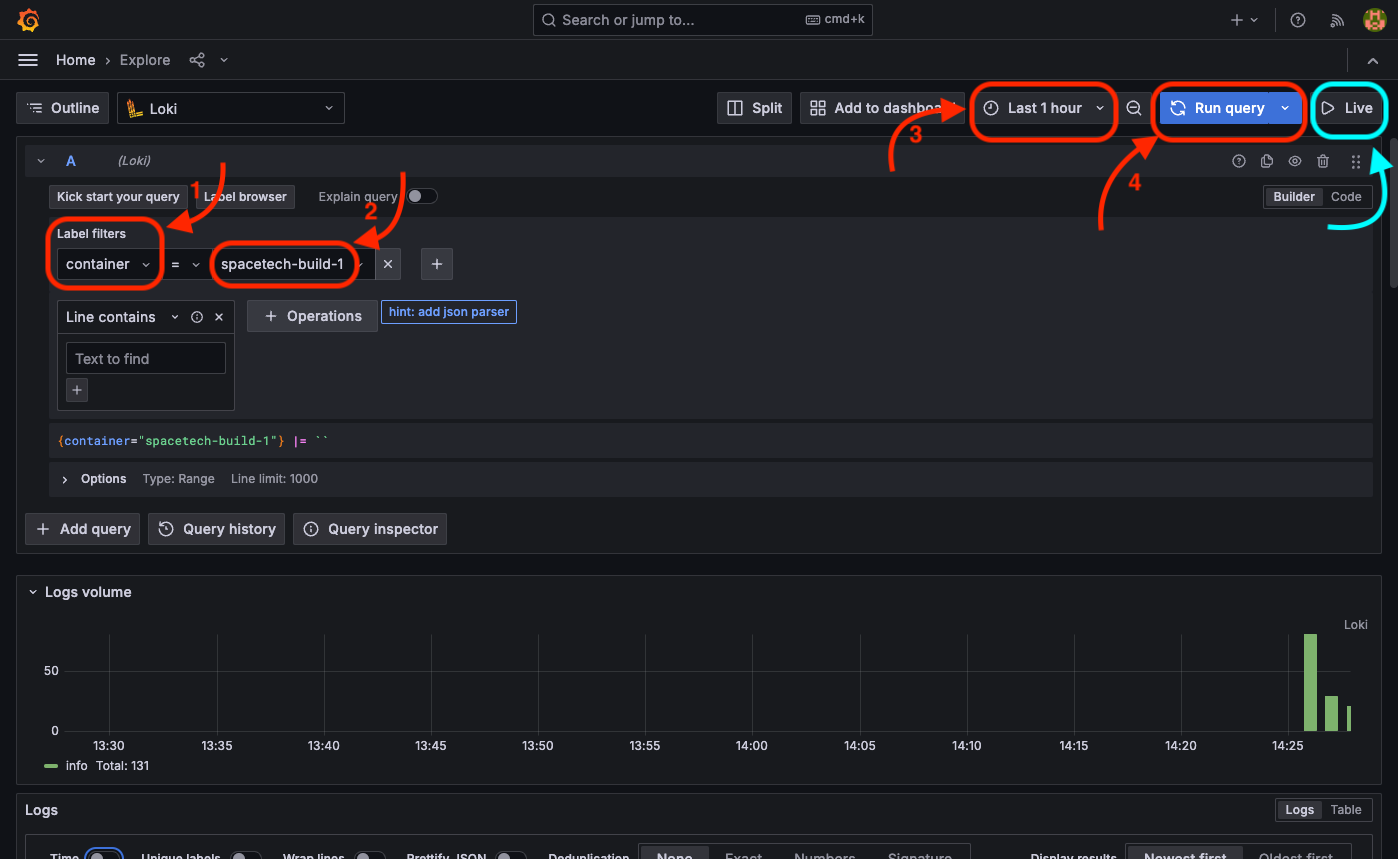
- Select
containeras label from1. box. - Select
spacetech-build-1as value from2. box. - Select the date time you want to query from
3. box. - After you set the query parameters, hit "Run query" button to see the logs.
- Additionally, if you want to "follow" the logs in realtime, you can hit "Live" button.
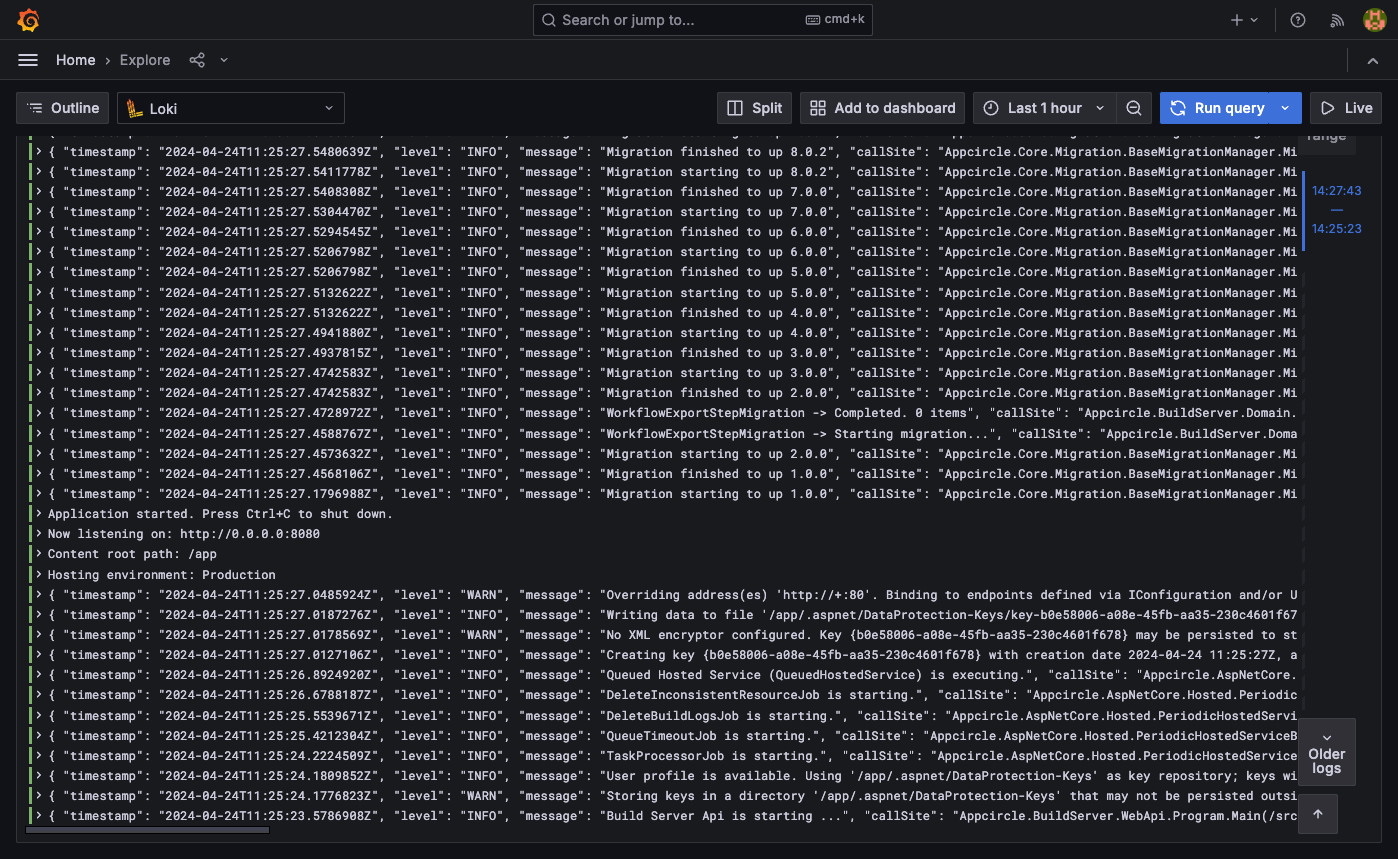
Upon executing the query by clicking the "Run query" button, the log entries generated by the spacetech-build-1 service will be displayed.
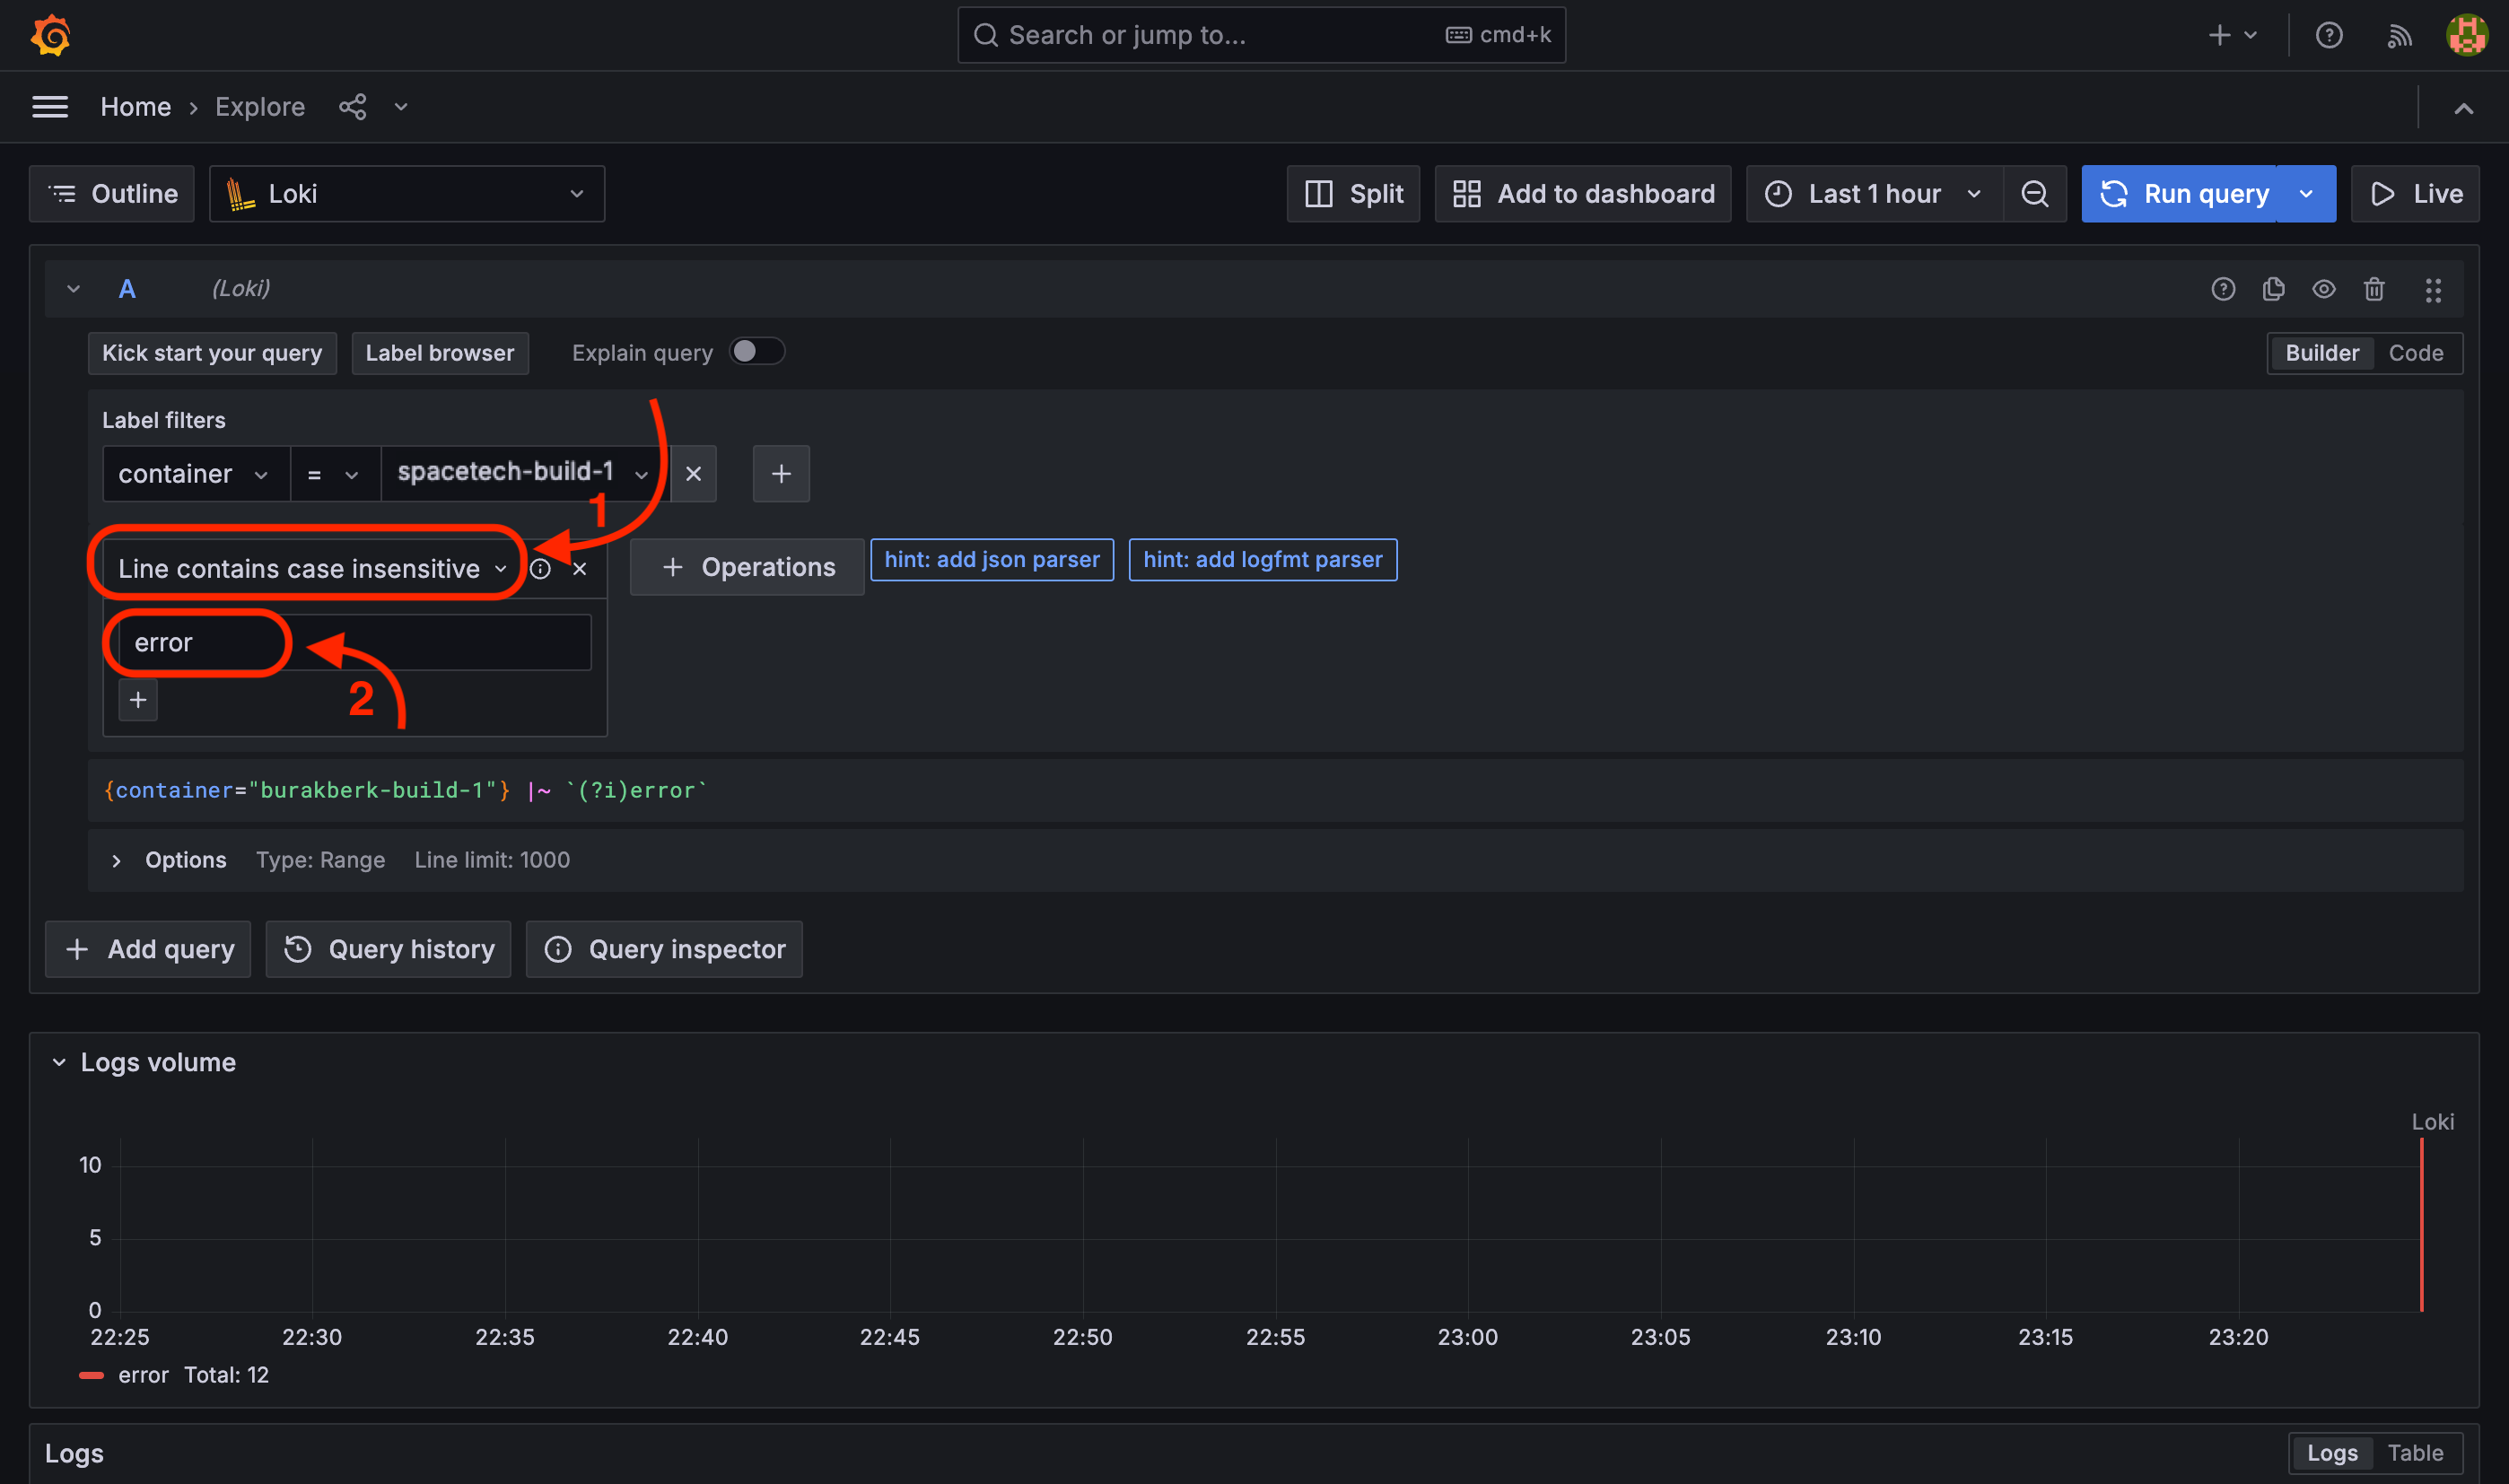
You can also filter words. For example you can filter any log line that contain "error" word.
- Select the
containerand relevant container. - Change filter to
Line contains case insensitivefor a case insensitive search. - Write "error" to the input.
- Select the date time and hit "Run query" button.
Downloading and Sharing the Logs
If you want to download and share the logs after you filter, you can the same UI.
- Filter the logs according to your needs.
- Hit the "Download" button from upper right corner of the logs.
- Select
txtas the format.
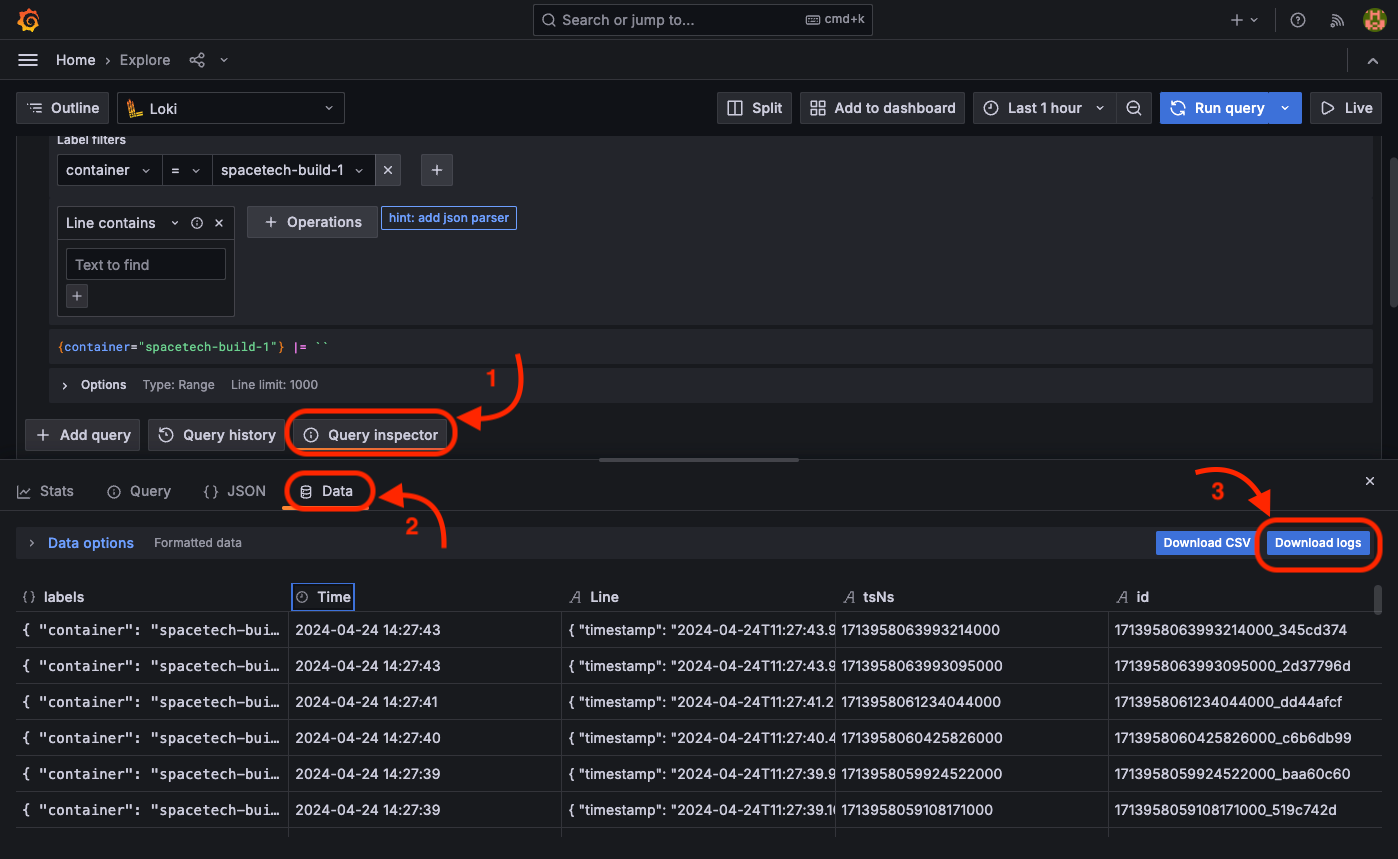
A file that contains the filtered logs will be downloaded to your local computer.
You can share that log file to troubleshoot the problems.
Grafana User Management
It is important to note that the user accounts for the Appcircle Server and the Grafana monitoring interface are entirely separate and unrelated entities. There is no direct association or shared credentials between these two user management systems.
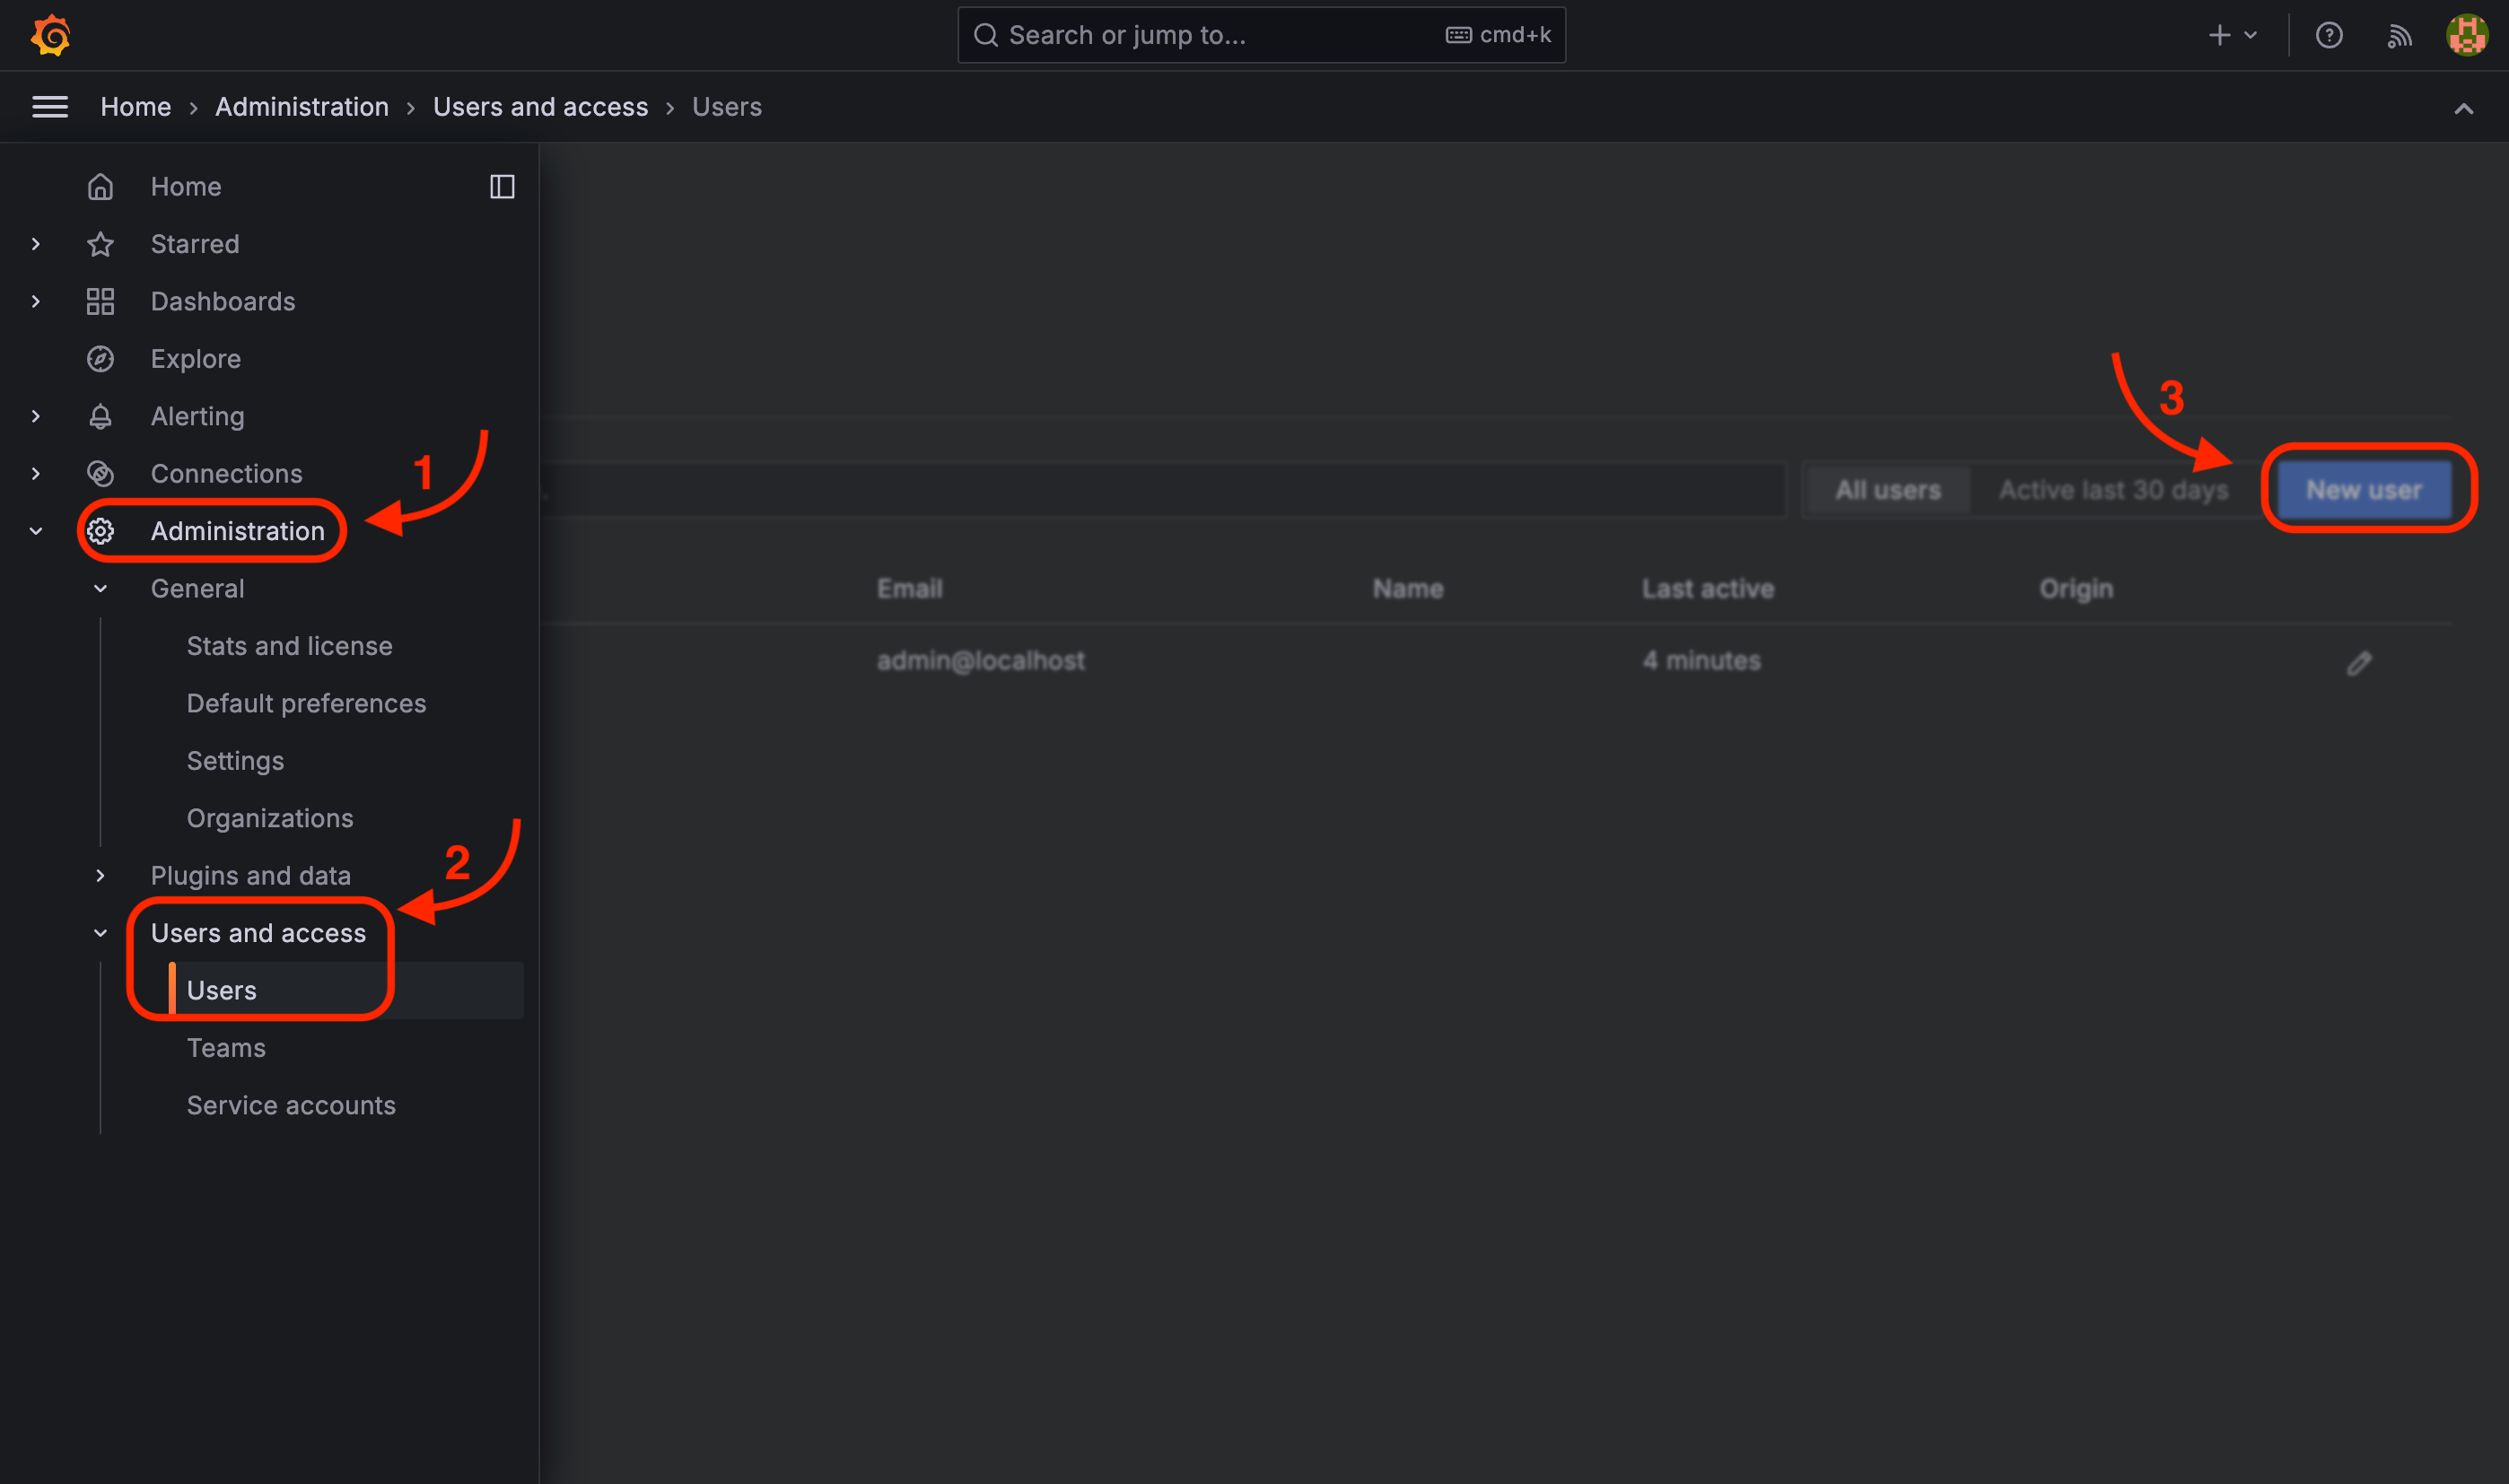
If you require additional users beyond the initial user account to have access to view log data, you can create new user accounts within the Grafana user management system.
To create a new user account, navigate to the "Administration" section of the Grafana interface, then access the "Users" menu. From there, click on the "New user" button to initiate the process of adding a new user.
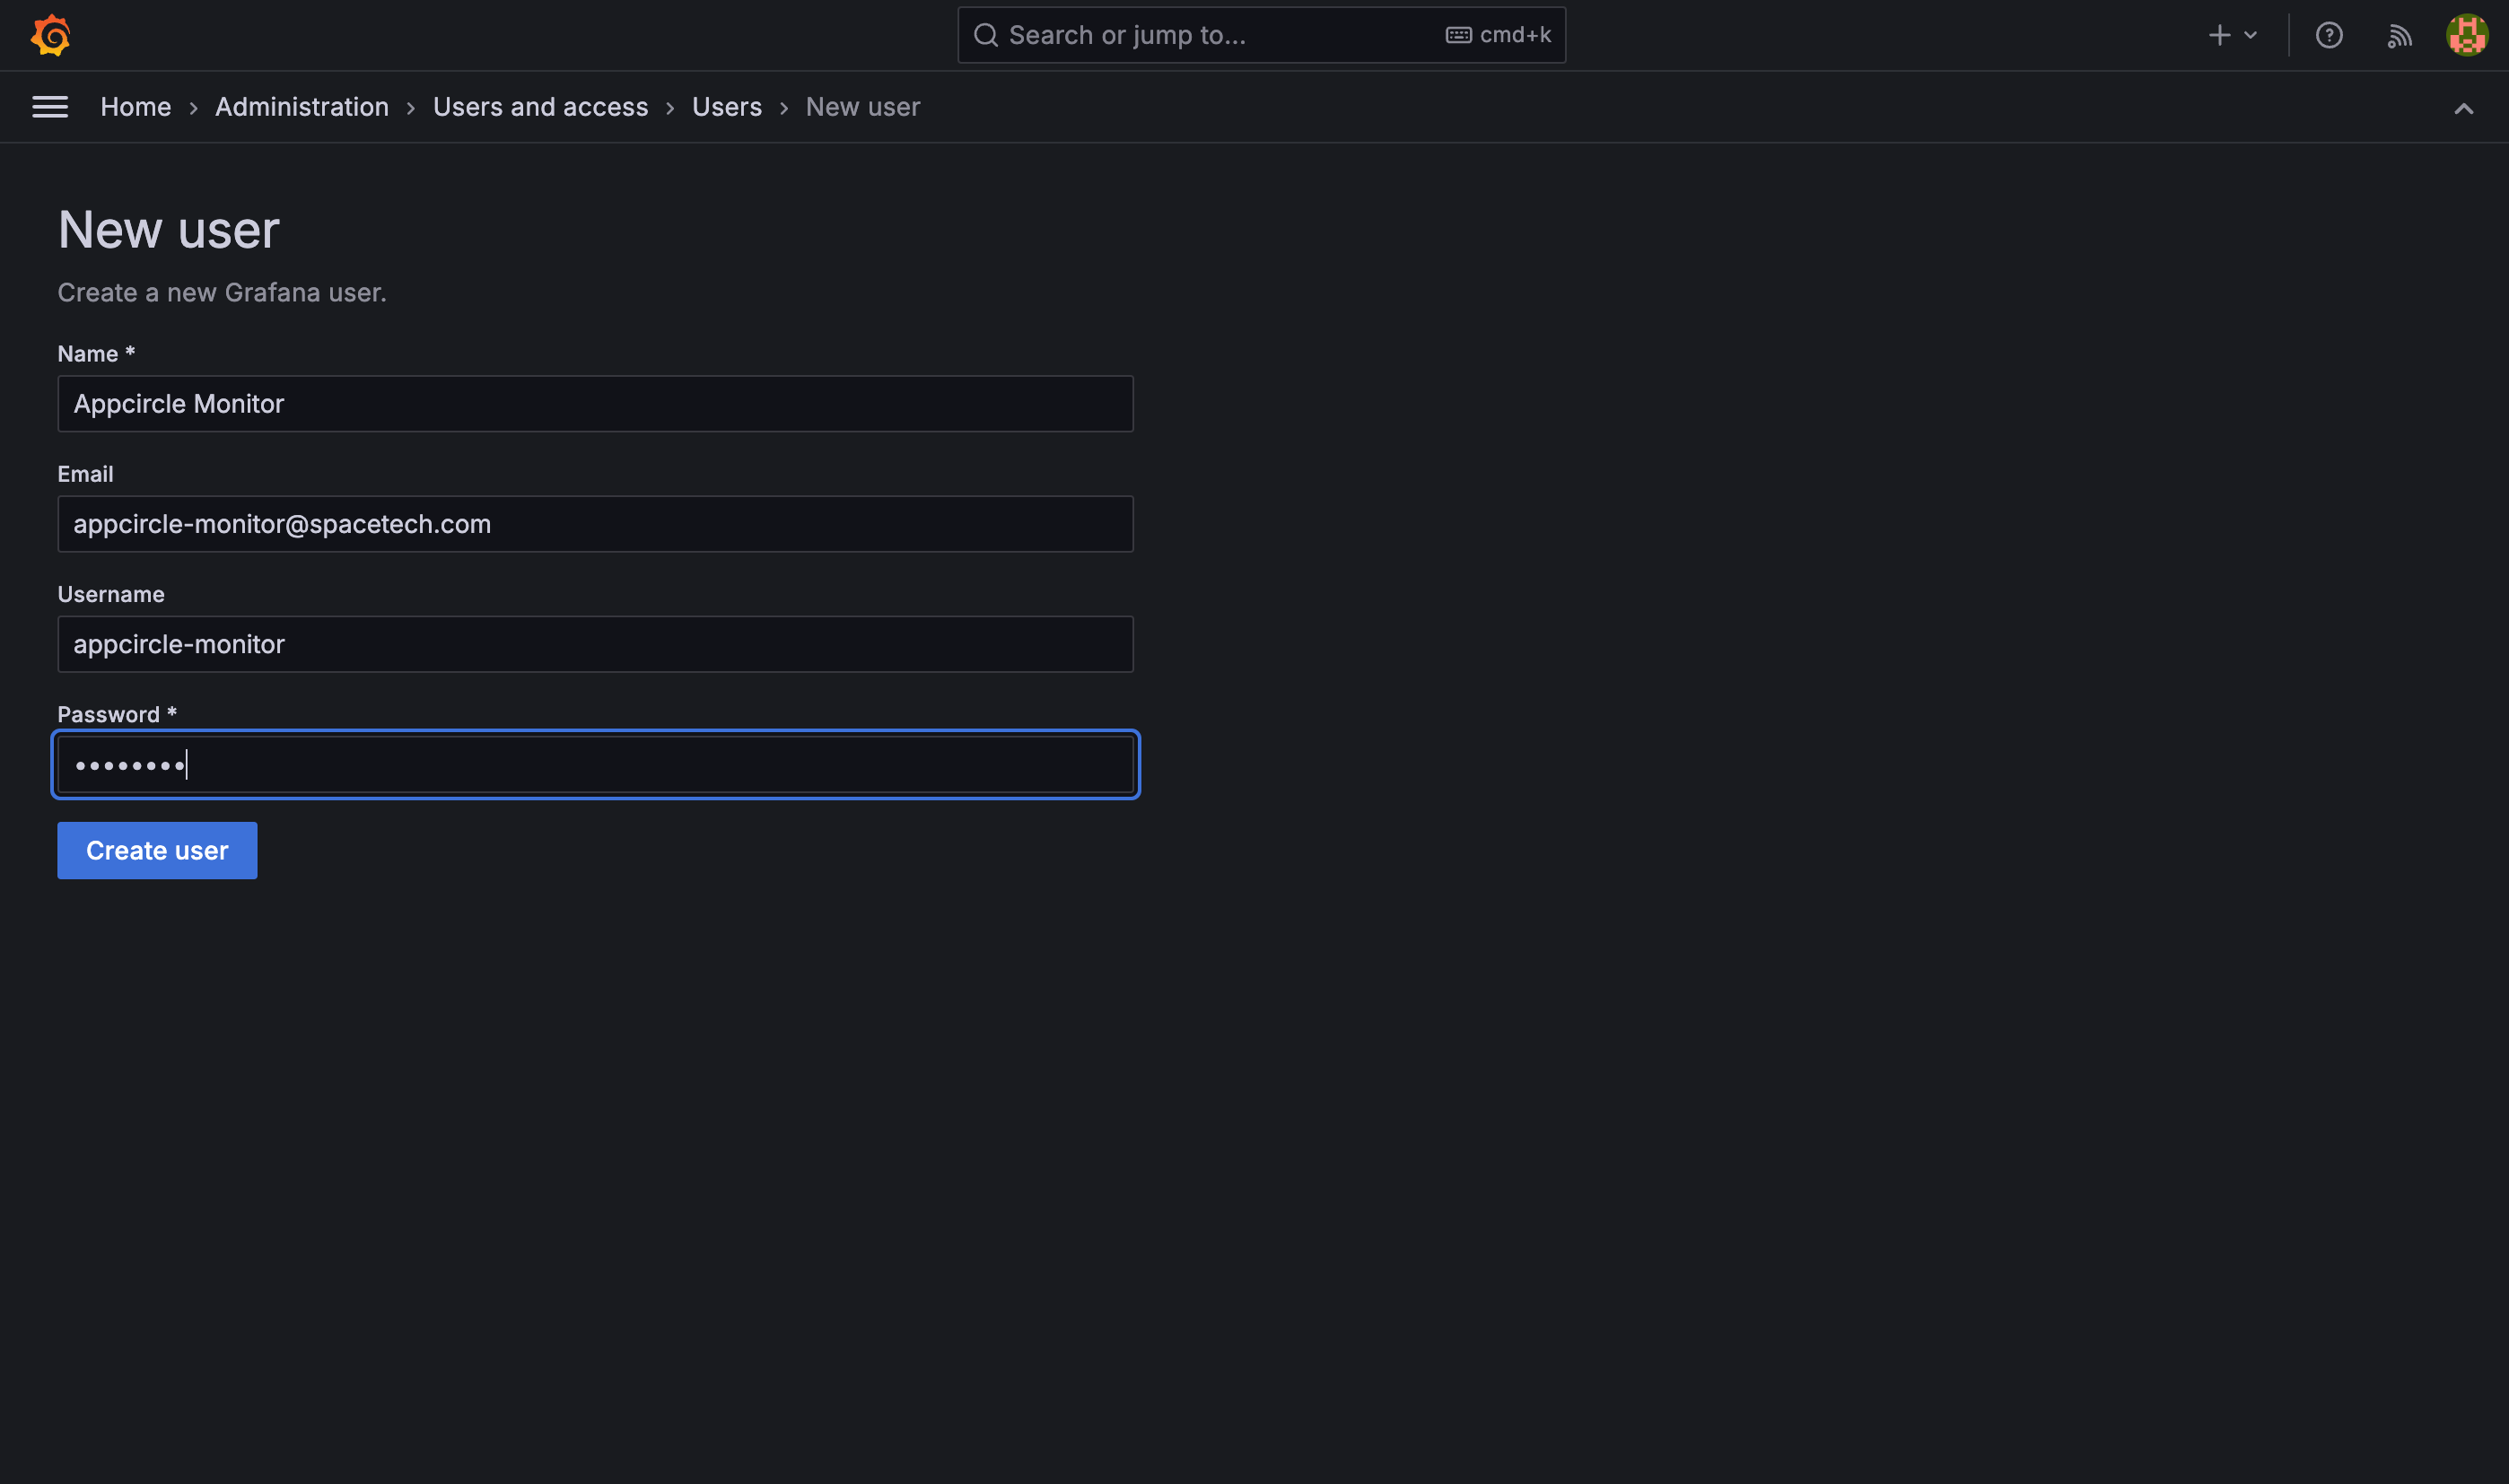
Provide the necessary user information in the respective fields, and then click the "Create user" button to save and create the new user account.
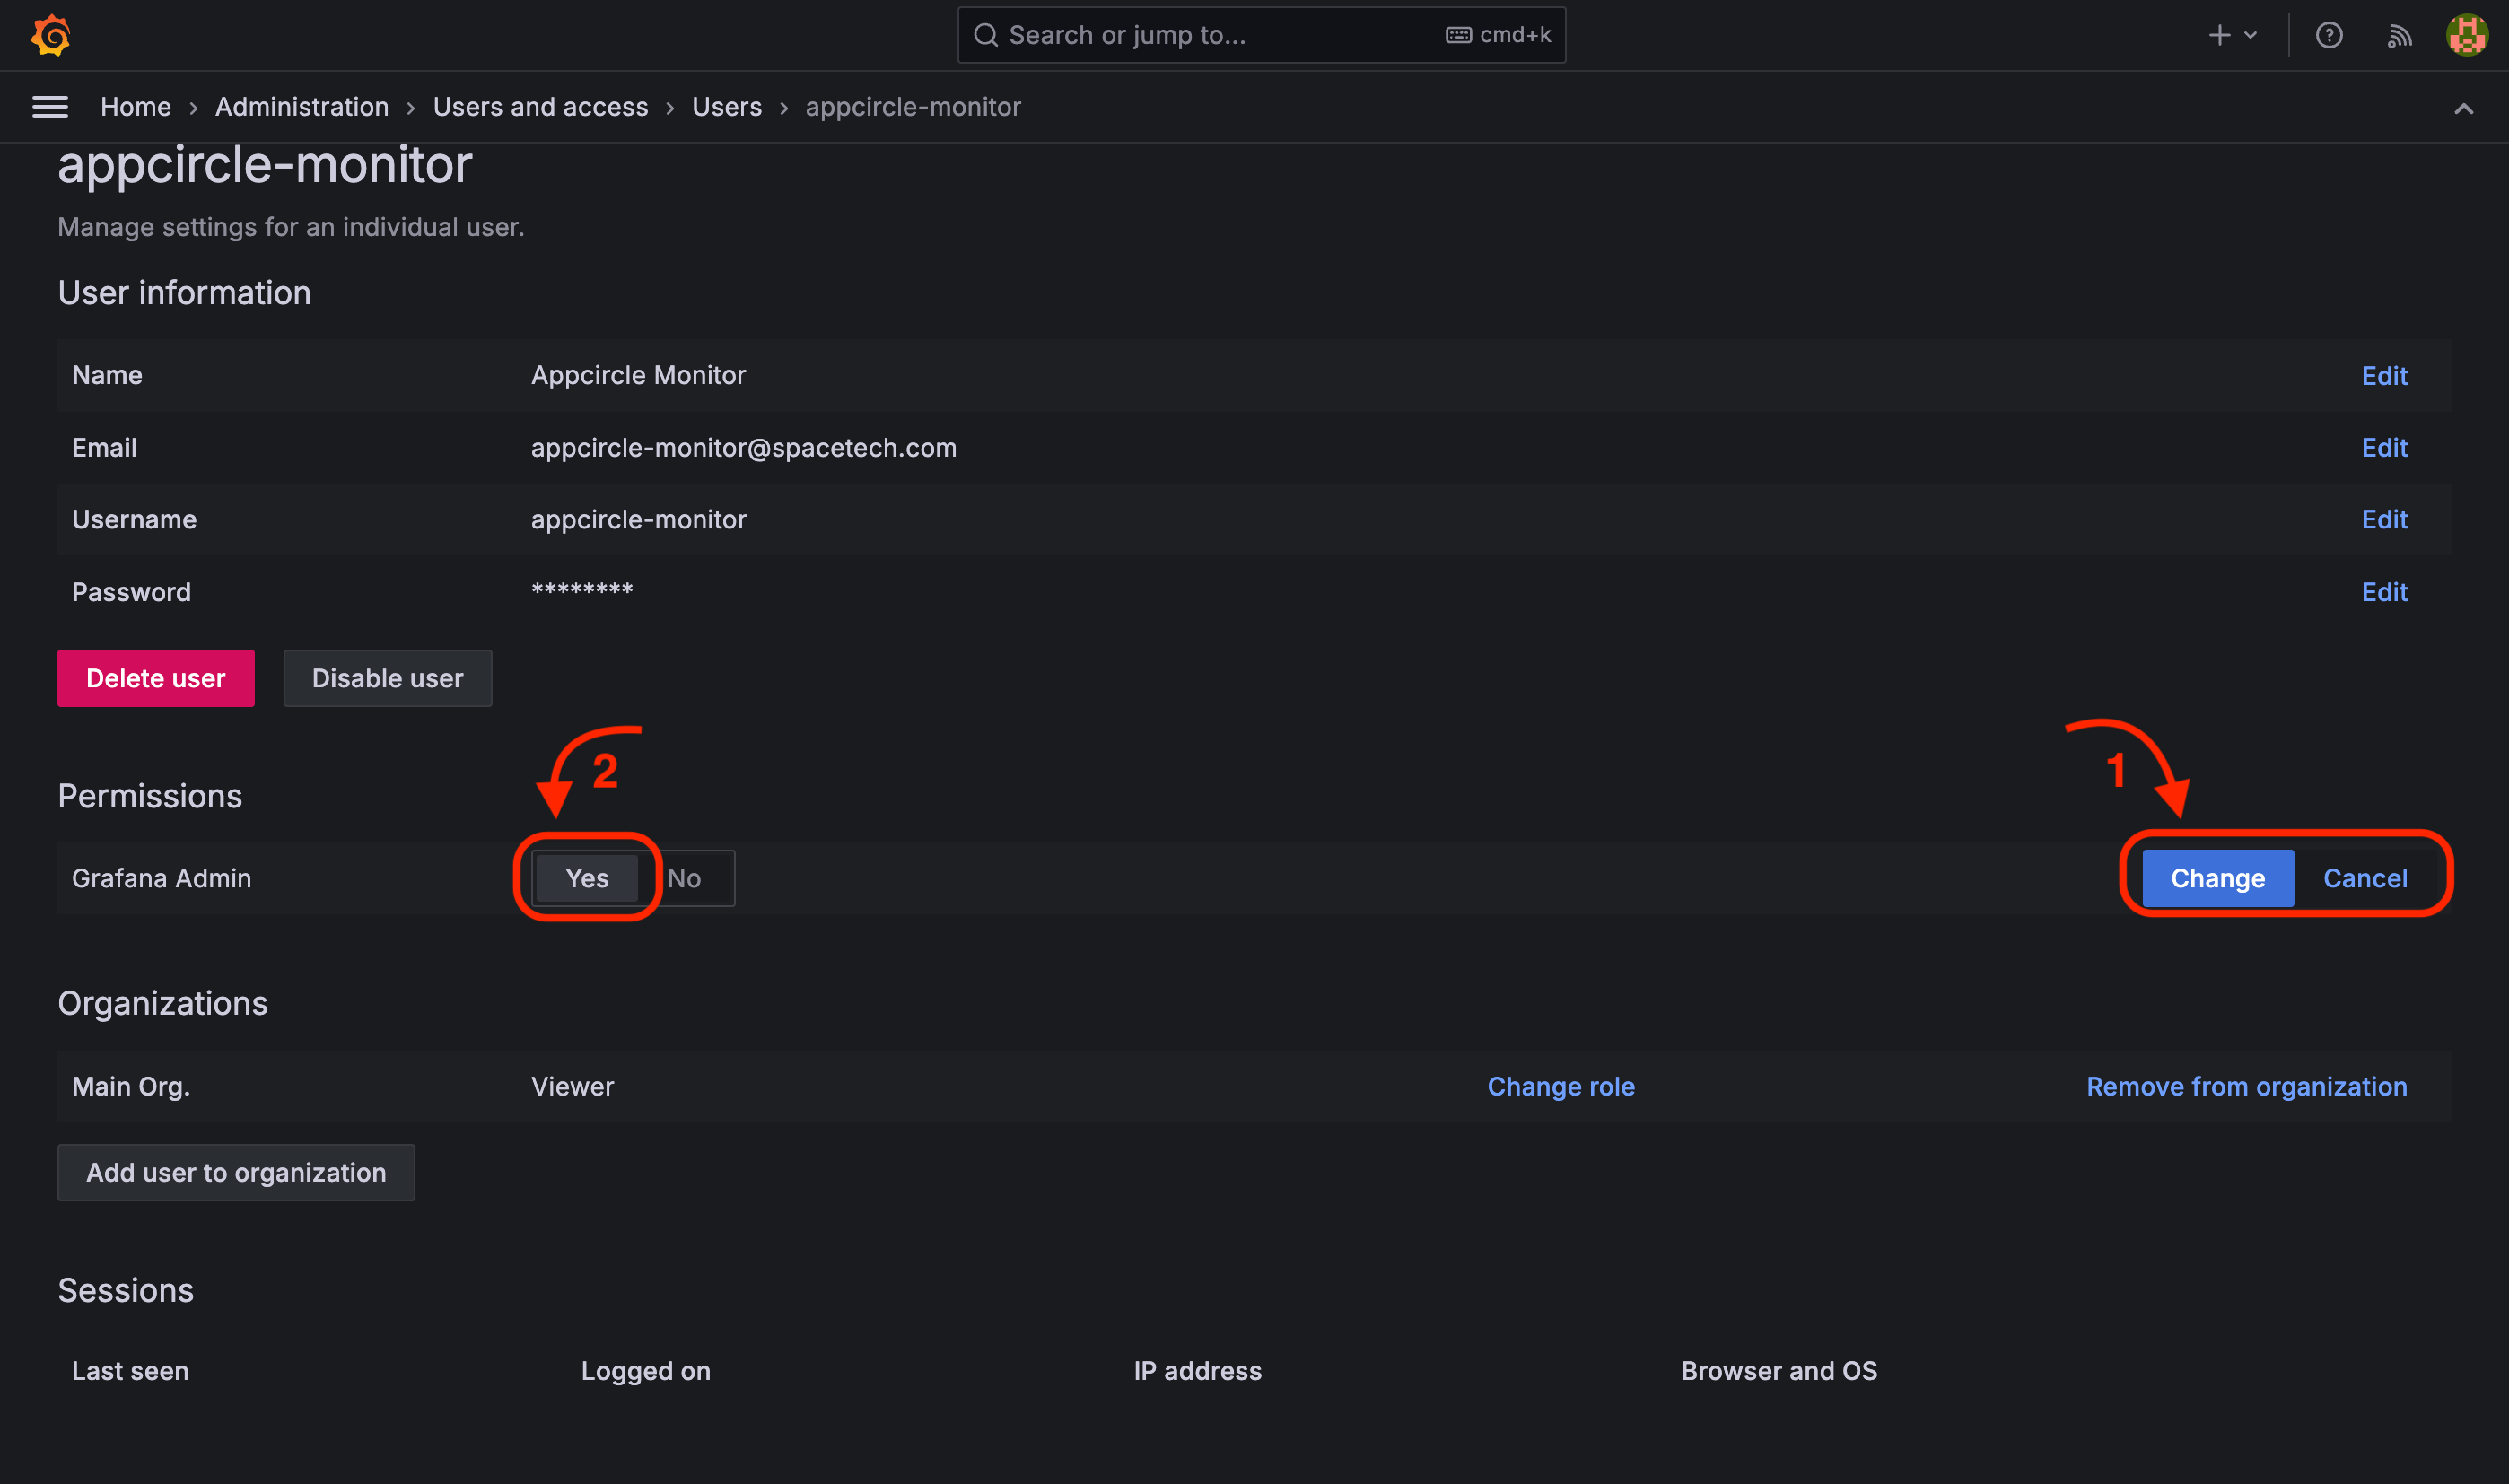
To grant administrative privileges to the user, click the "Change" button and toggle the "Grafana Admin" switch to the "Yes" position. Click "Change" again to confirm and save the updated permissions.
For more detailed information, you can check the official Grafana User Management documentation.
Disable the Monitoring Services
The monitoring services have been activated in the default configuration. However, you can disable them when you need to and then re-enable them again.
If you need to disable the monitoring services of the Appcircle server, edit the global.yaml file of your project and set the monitoring.enabled parameter to false.
Be aware that this process will cause downtime since it requires a restart of the Appcircle server.
The spacetech in the example codes below are example project name.
Please find your own project name and replace spacetech with your project name.
To see projects, you can check the projects directory.
ls -l ./projects
- Go to the
appcircle-serverdirectory.
cd appcircle-server
- Edit the
global.yamlfile of your project.
vi ./projects/spacetech/global.yaml
- Add or update the
monitoring.enabledparameter as below.
monitoring:
  enabled: false
If you can't find the monitoring parameter in the global.yaml file, you can add it manually at the end of the global.yaml.
- Shutdown Appcircle server.
./ac-self-hosted.sh -n "spacetech" down
- Apply configuration changes.
./ac-self-hosted.sh -n "spacetech" export
- Boot Appcircle server.
./ac-self-hosted.sh -n "spacetech" up
You should check the status of the Appcircle server after boot for any possible errors.
./ac-self-hosted.sh -n "spacetech" check
When you run the check command, you should see that the logging service is not running, as below:
Appcircle logging service is not running.
All services are running successfully. Project name is spacetech
When you need to re-enable the monitoring services again, you can remove monitoring from global.yaml or set its value to true. After that, you should follow the Appcircle server restart steps above to apply the configuration changes.
Disabling the Appcircle monitoring services does not disable the Appcircle logging.
You can always access the container logs from container engine (docker or podman).
The container logs are also sent to the systemd journal. So the log entries can be retrieved using the journalctl command through the journal API. For more information, see the journald logging driver page.
FAQ
Filtering "Error" Logs for All Containers
To query case-insensitive "error" logs for all containers using the Grafana Explore menu, follow these steps:
-
Select the
service_nameLabel: In the query builder, ensure theservice_namelabel is selected to filter logs by service name. -
Use the Matches Regex Operator (
=~): Instead of using the equals operator (=), choose the matches regex operator (=~). This allows for more flexible pattern matching. -
Set the Target to
.+: In the regex field, enter.+to match any service name, effectively including all containers in the query. -
Add a "Line Contains Case Insensitive" Filter: Add a filter for log lines that contain the term "error" in a case-insensitive manner by entering
errorin the search field. -
Enable the "Unique Labels" Toggle: Enable the "Unique labels" toggle to display which service each log entry originates from, providing clearer insight into your log data.
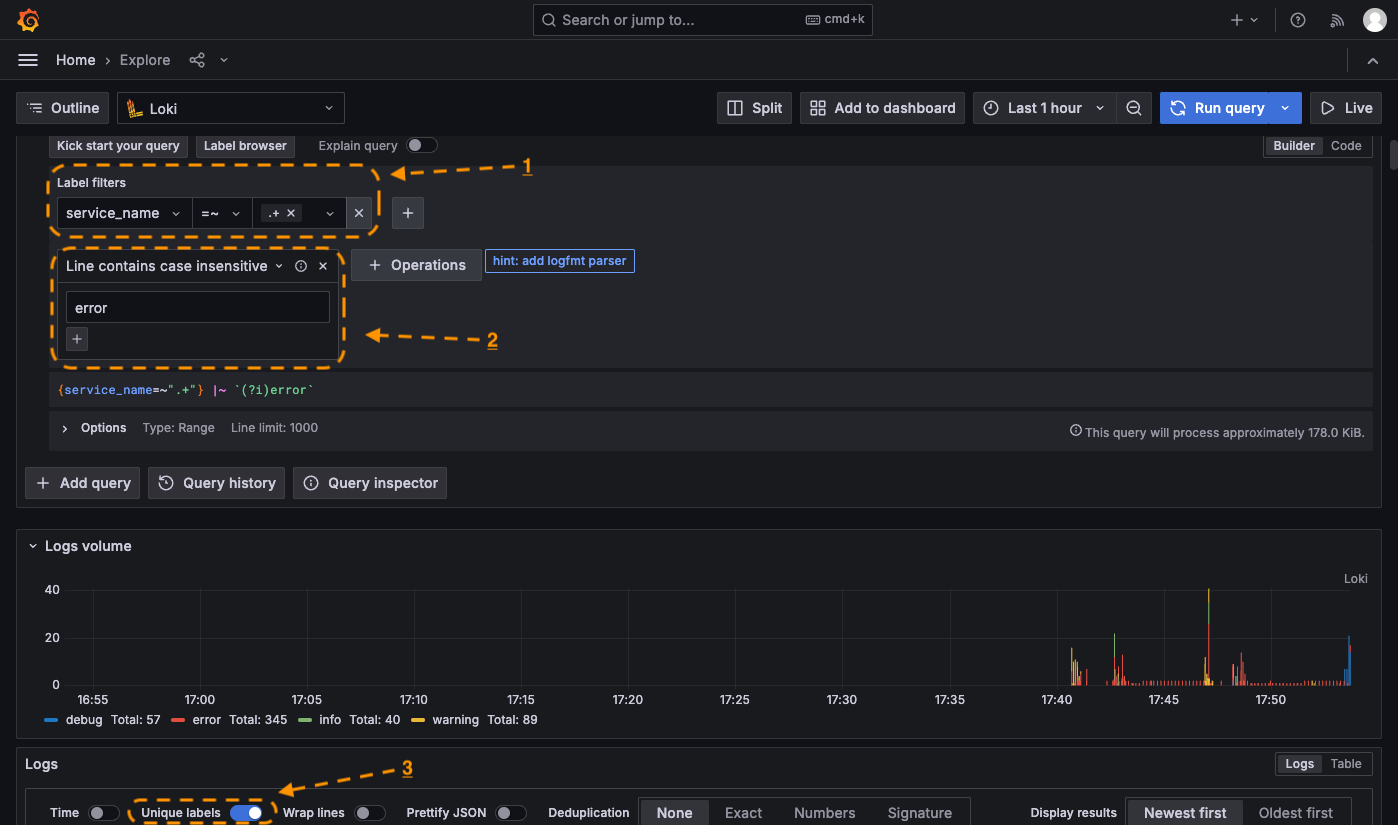
If you face any error on the Appcircle, you can effectively search for logs containing the term "error" across all services by performing these steps.
Missing Container Logs in Grafana UI
If container logs are not visible in the Grafana UI, this may be caused by either the Appcircle logging service not running or insufficient user permissions. Follow these steps to resolve the issue:
-
Log in to the Appcircle server with SSH.
-
Go to the Appcircle server directory.
cd appcircle-server -
Start the Appcircle server.
infoThe
spacetechin the example codes below are example project name.Please find your own project name and replace
spacetechwith your project name.To see projects, you can check the
projectsdirectory.ls -l ./projects./ac-self-hosted.sh -n spacetech up -
Verify the Appcircle logging service status:
infoAfter you start the Appcircle server,
appcircle-loggingservice will be running with theactivestatus.
- Non-Root User
- Root User
systemctl --user status appcircle-logging
systemctl status appcircle-logging
-
If the logging service is running but container logs are still not visible in the Grafana UI, this may indicate insufficient permissions, especially for the non-root user. To resolve this:
- Check the groups of the user who runs the Appcircle server.
groups $USER- Add the user to the necessary system groups if the user is not in the
admorsystemd-journalgroups.
infoThe users who belong to these groups can access the journal logs or system logs without root privileges.
sudo usermod -aG adm $USERsudo usermod -aG systemd-journal $USER- Stop the Appcircle server:
./ac-self-hosted.sh -n spacetech down- Terminate the current user session:
loginctl terminate-user $USER- Start the Appcircle server:
./ac-self-hosted.sh -n spacetech up