Build Insights Report
The Build Insights Report gives you a snapshot of your CI health: build trends, failure root causes, workflow quality, artifact health, queue time, and an overall maturity score. Use the Appcircle Claude Assistant or Appcircle Copilot Assistant to get a visual report, or use the Appcircle MCP client directly.
How to Generate a Report
With the Appcircle Claude Assistant
- Ask in natural language, for example give me a build insights report for last month or how is our CI maturity.
- The
build-insights-reportskill makes one call toget_build_insights_reportand renders the response as a report.
With the Appcircle Copilot Assistant
- Ask in natural language, for example give me a build insights report for last month or how is our CI maturity.
- The
build-insights-reportskill makes one call toget_build_insights_reportand renders the response as a report.
With Any Other MCP Client
- Call
get_build_insights_reportdirectly from any MCP-compatible client (Cursor, VS Code, Codex, and so on). - You get the same metrics as structured JSON, which you can read, feed into another tool, or visualize yourself.
Report Sections
The report has six sections.
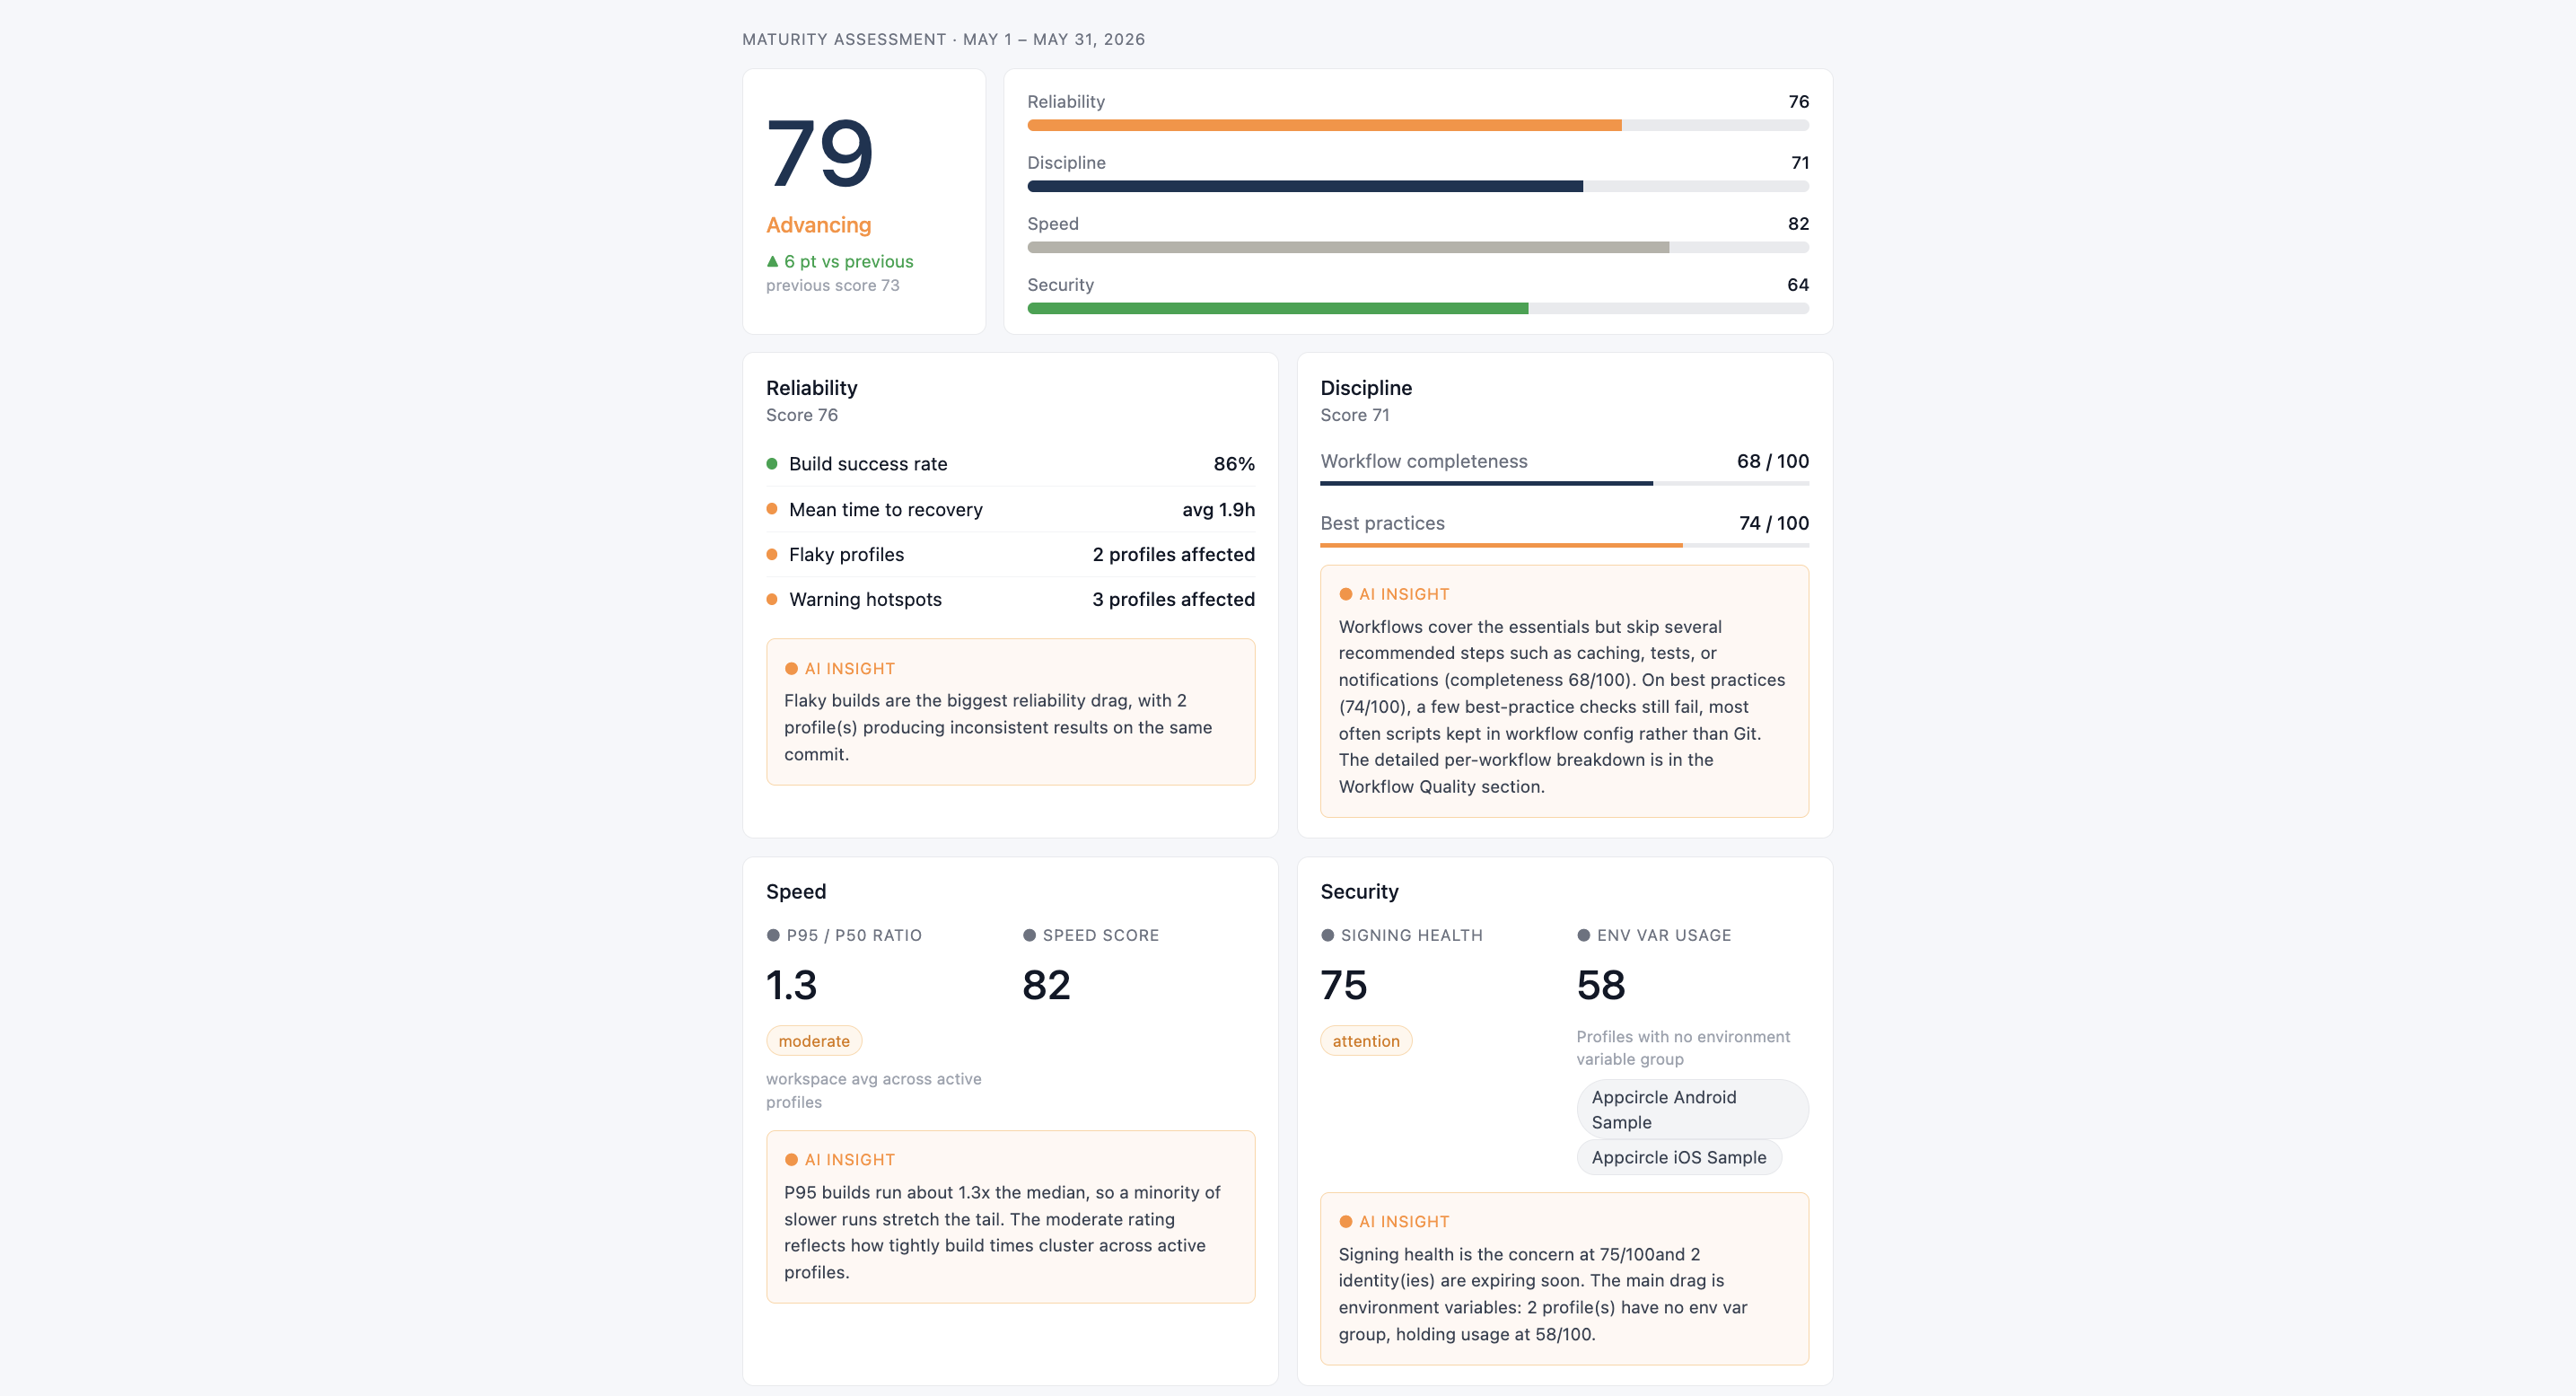
Maturity Assessment
A single CI maturity score (0-100) for the period, with a label of Developing, Practicing, Advancing, or Optimizing, and the delta against the previous period. The overall score rolls up four weighted dimensions:
| Dimension | What it measures |
|---|---|
| Reliability | Build success rate, mean time to recovery (MTTR), number of flaky build profiles (same commit both passing and failing), and profiles with recurring warning hotspots |
| Discipline | Workflow completeness against Appcircle's recommended steps, and adherence to configuration best practices |
| Speed | How consistent build durations are (P95/P50 ratio) and an overall speed score across active profiles |
| Security | Signing identity health, environment variable group usage, and certificates or provisioning profiles nearing expiry |
Below the scores, a ranked Top Improvements list surfaces the highest-impact actions for the period, each with the affected build profiles. Typical items include:
- Resolving flaky profiles
- Migrating custom scripts to Git
- Configuring PR workflows
- Configuring environment variable groups
- Renewing signing identities that are close to expiring
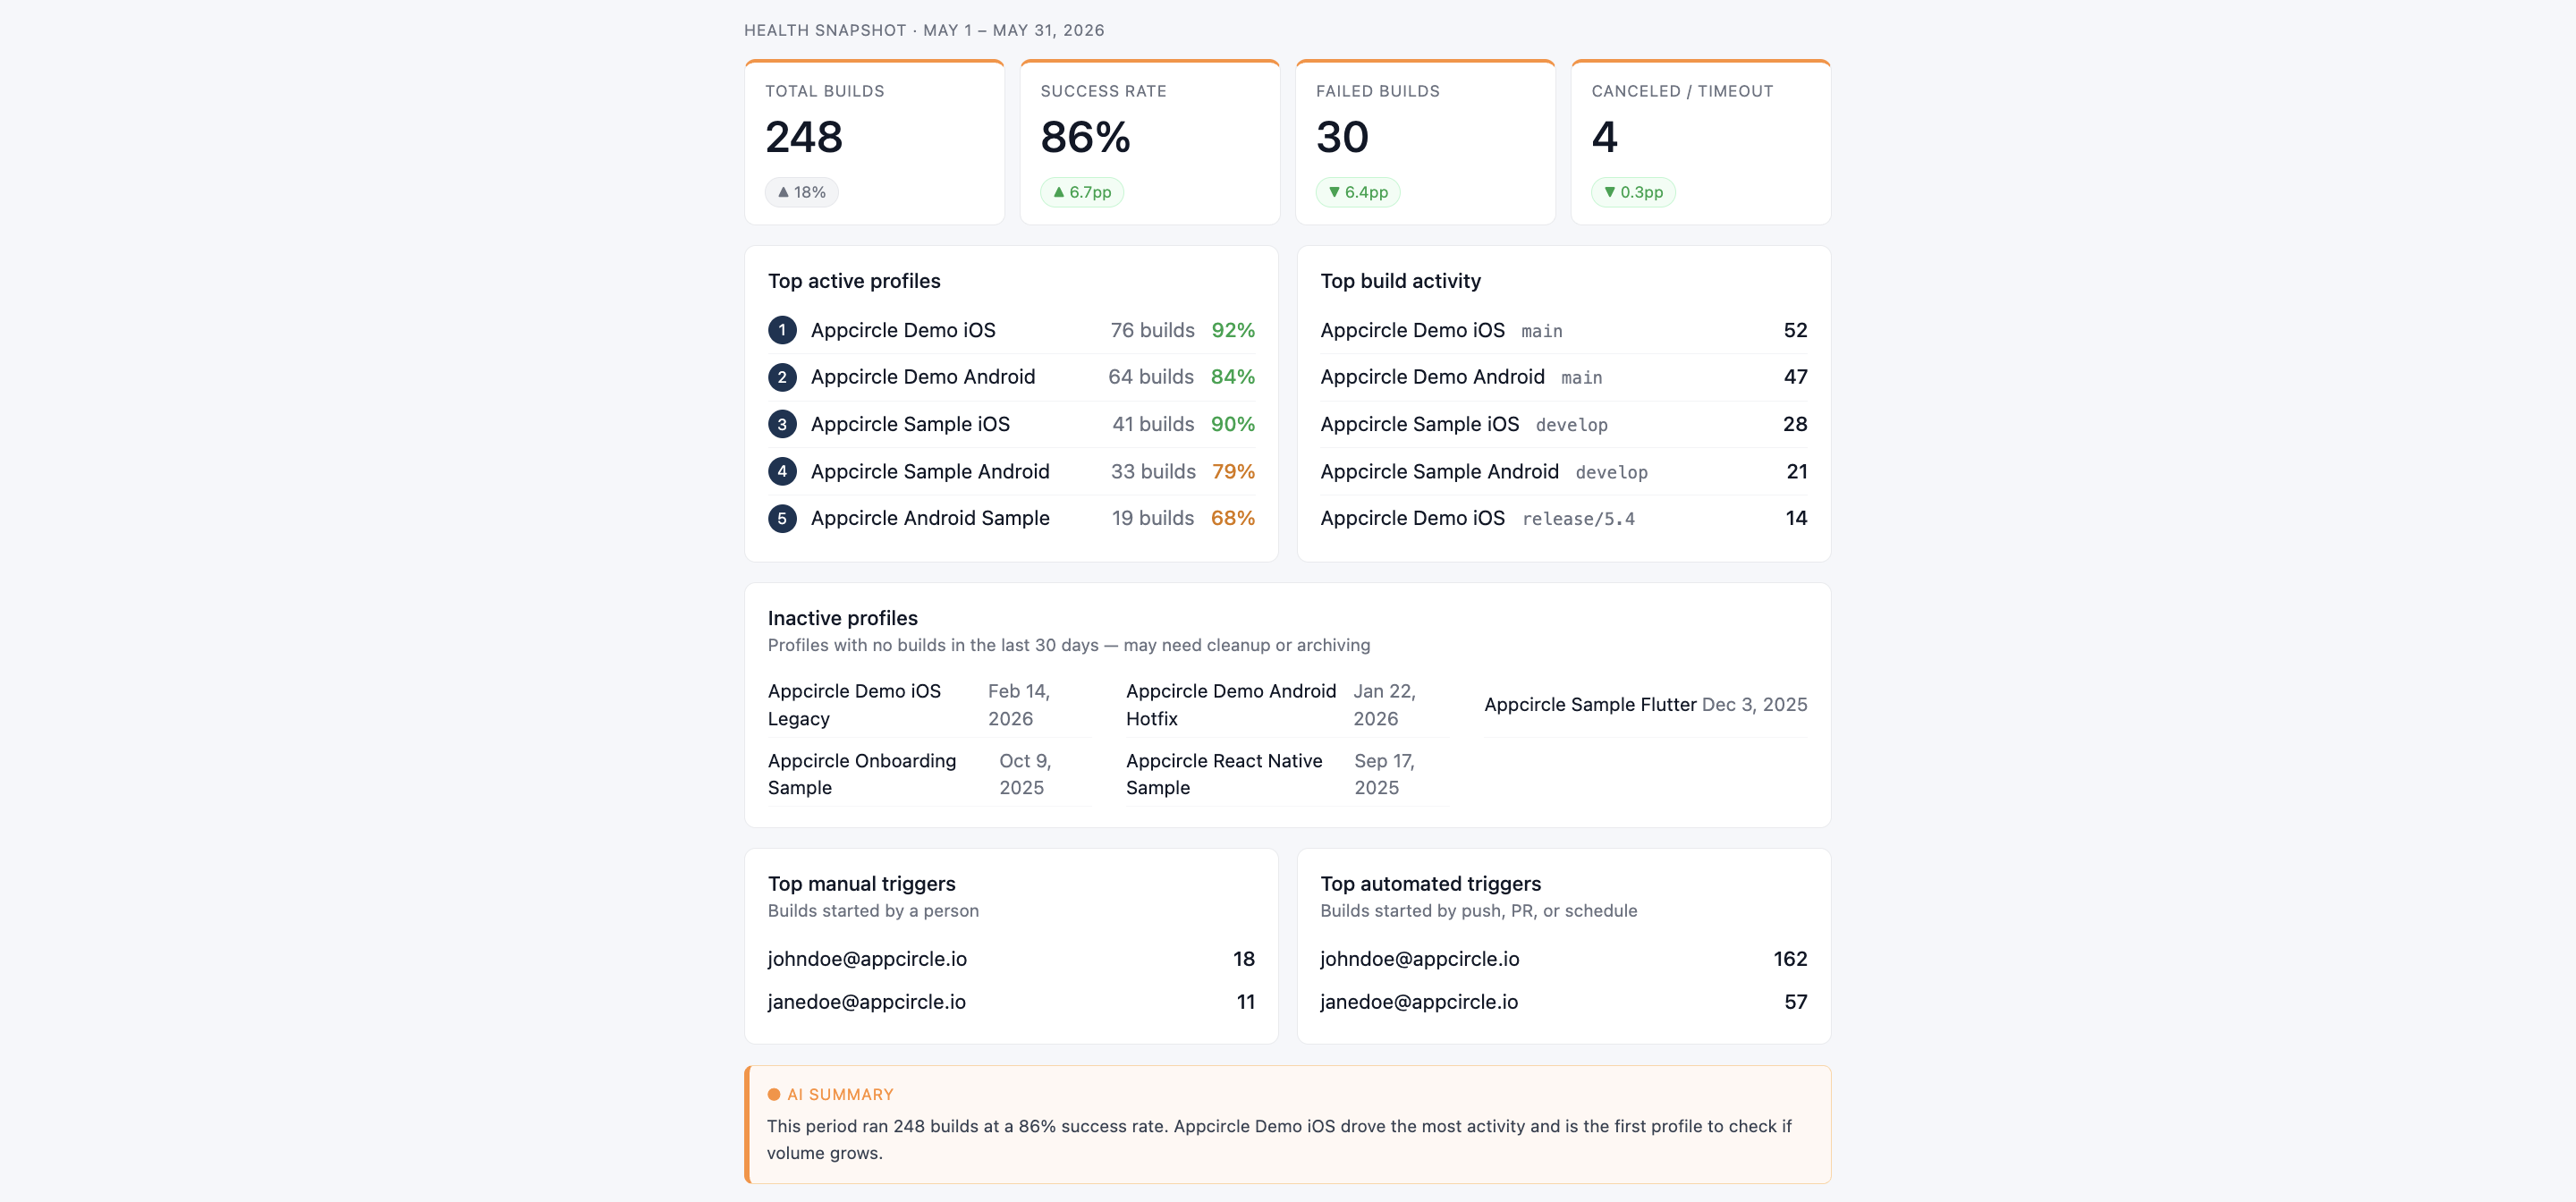
Health Snapshot & Trends
Health Snapshot is a point-in-time view of the period:
- Summary cards for total builds, success rate, failed builds, and canceled/timeout builds, each with the change versus the previous period.
- Top active profiles: the busiest build profiles, with build counts and success rates.
- Inactive profiles: profiles with no builds in the last 30 days, as cleanup or archiving candidates.
- Top build activity: the most active profile/branch combinations.
- Top manual and automated triggers: who is starting the builds and how (manual or trigger).
- An AI-authored summary of the period's overall volume and success-rate signal.
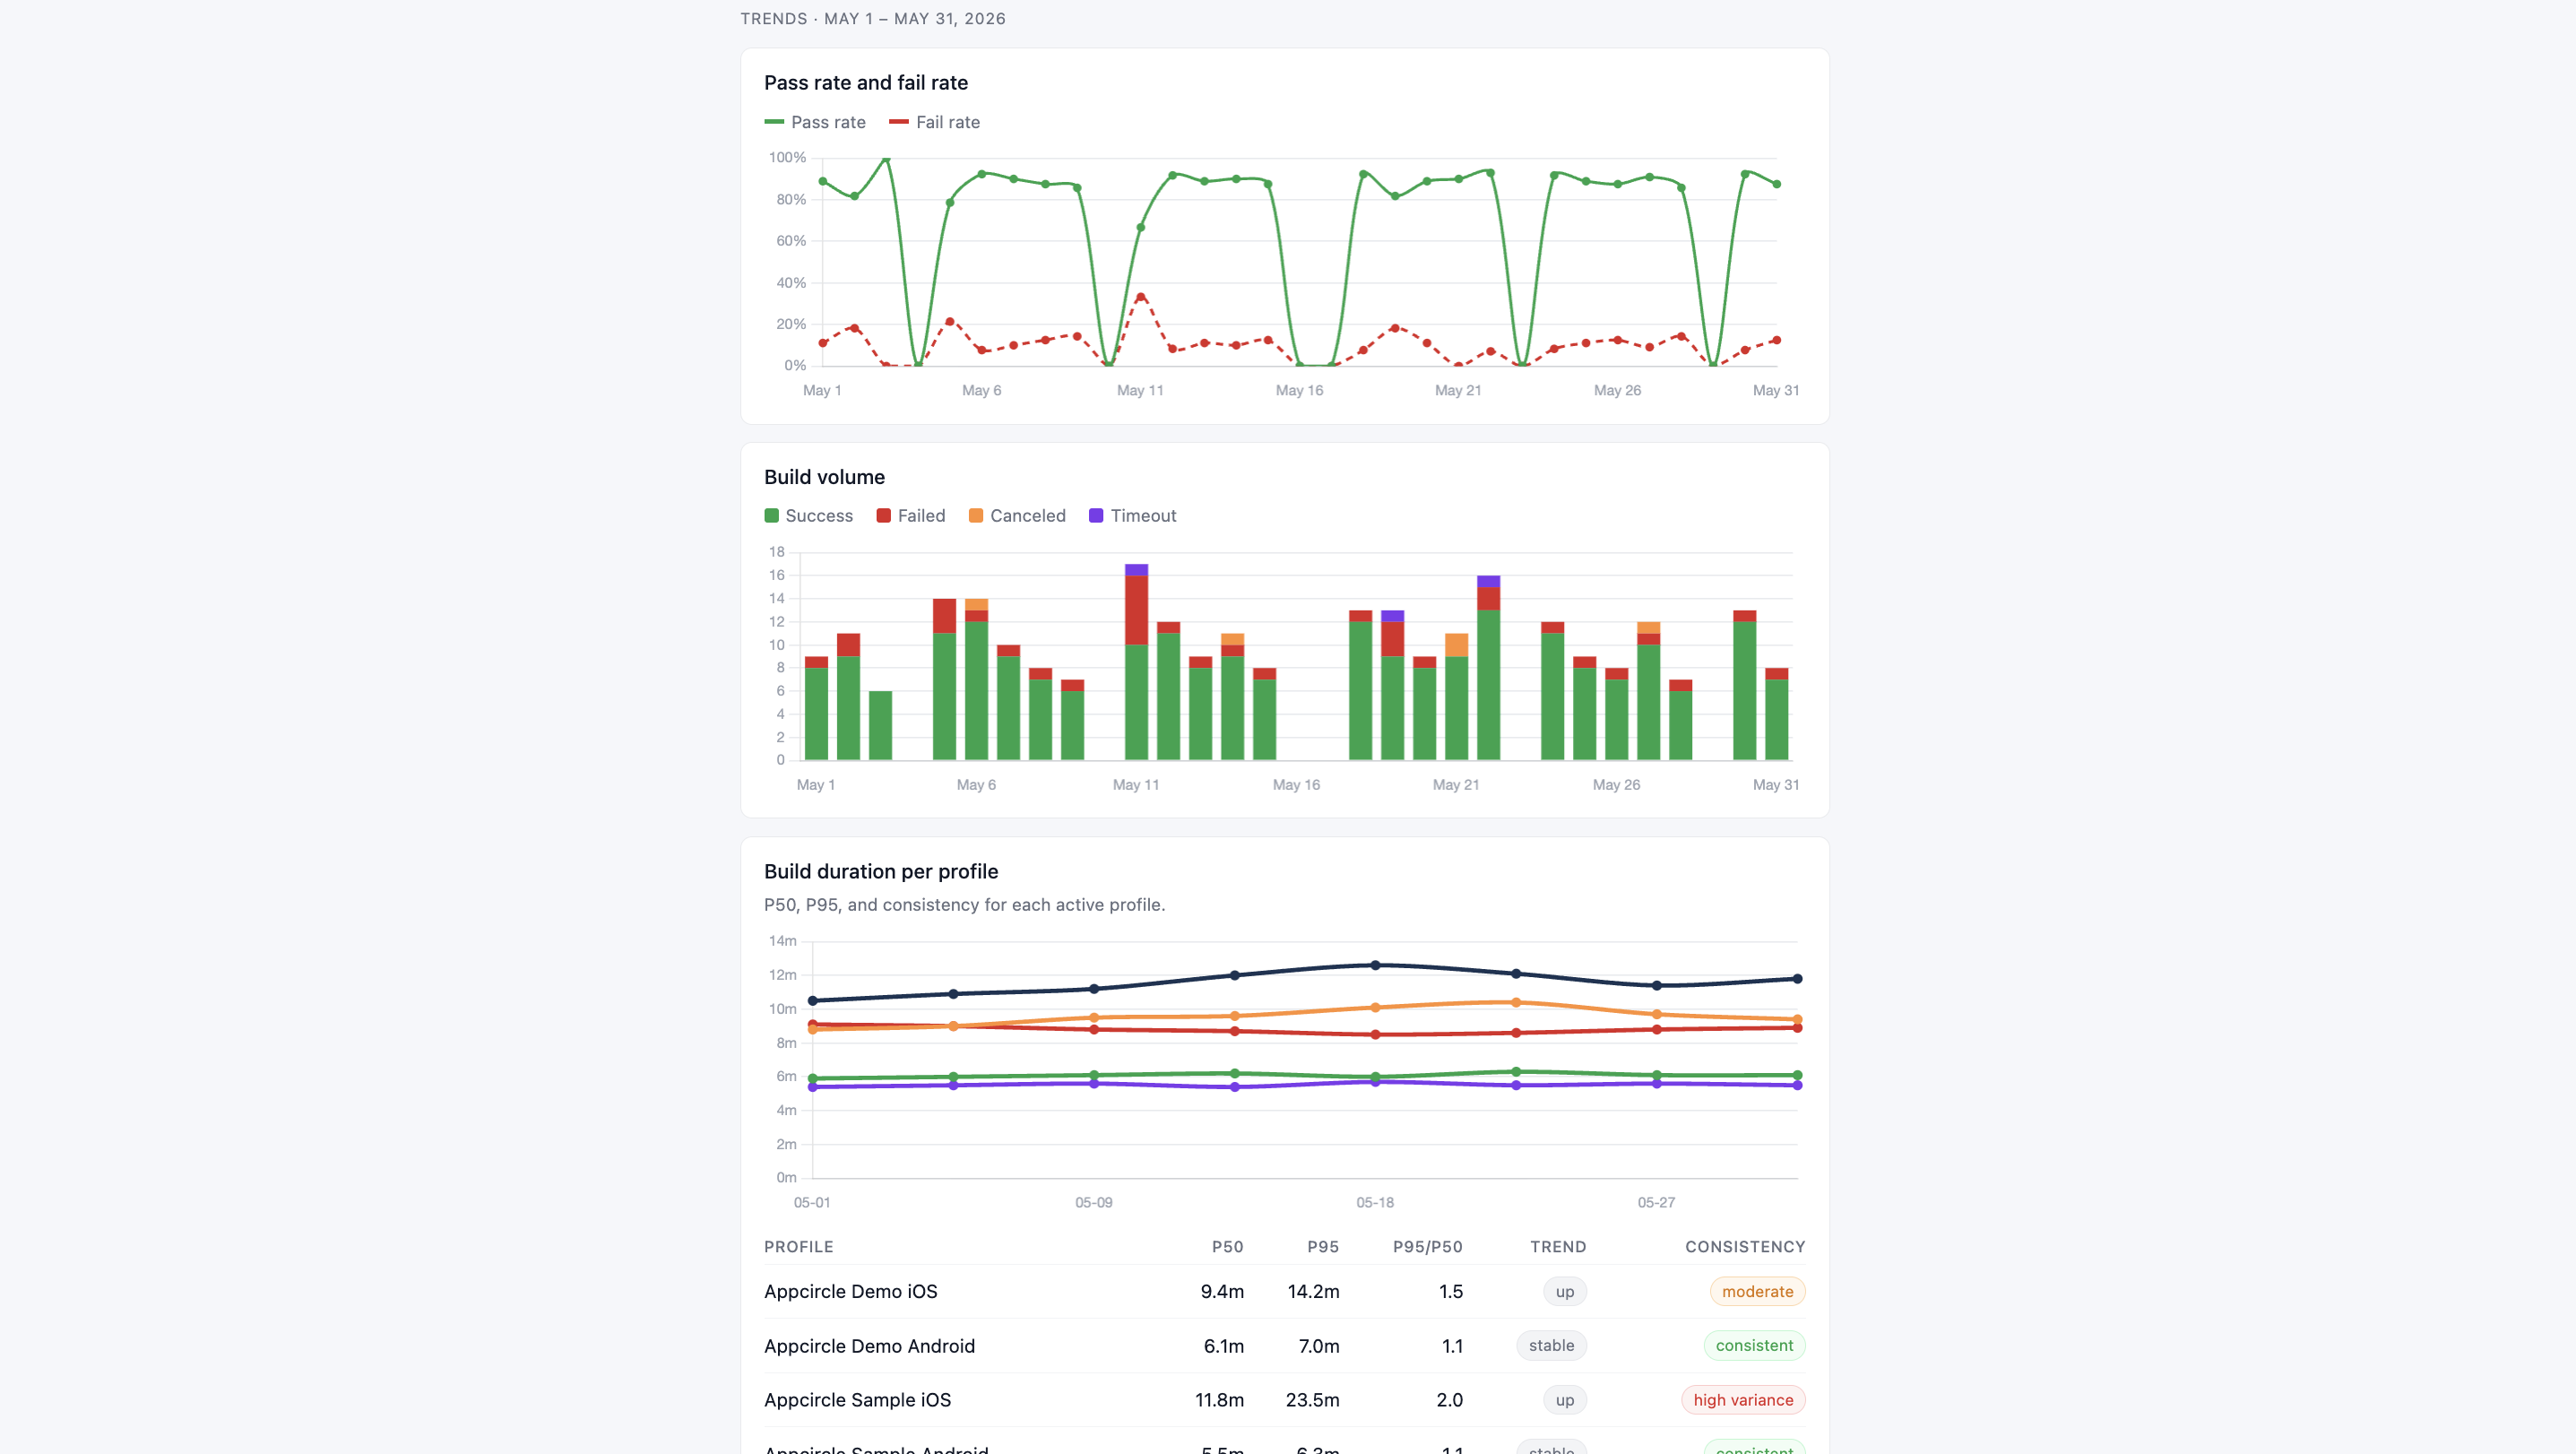
Trends plots the same window over time:
- Daily pass rate and fail rate.
- Daily build volume, broken down by success, failed, canceled, and timeout.
- Per-profile build duration, both as a chart of median (P50) build time over the period and as a table of P50, P95, the P95/P50 ratio, a trend (faster/stable/slower), and a consistency rating (consistent/moderate/high variance) for each active profile.
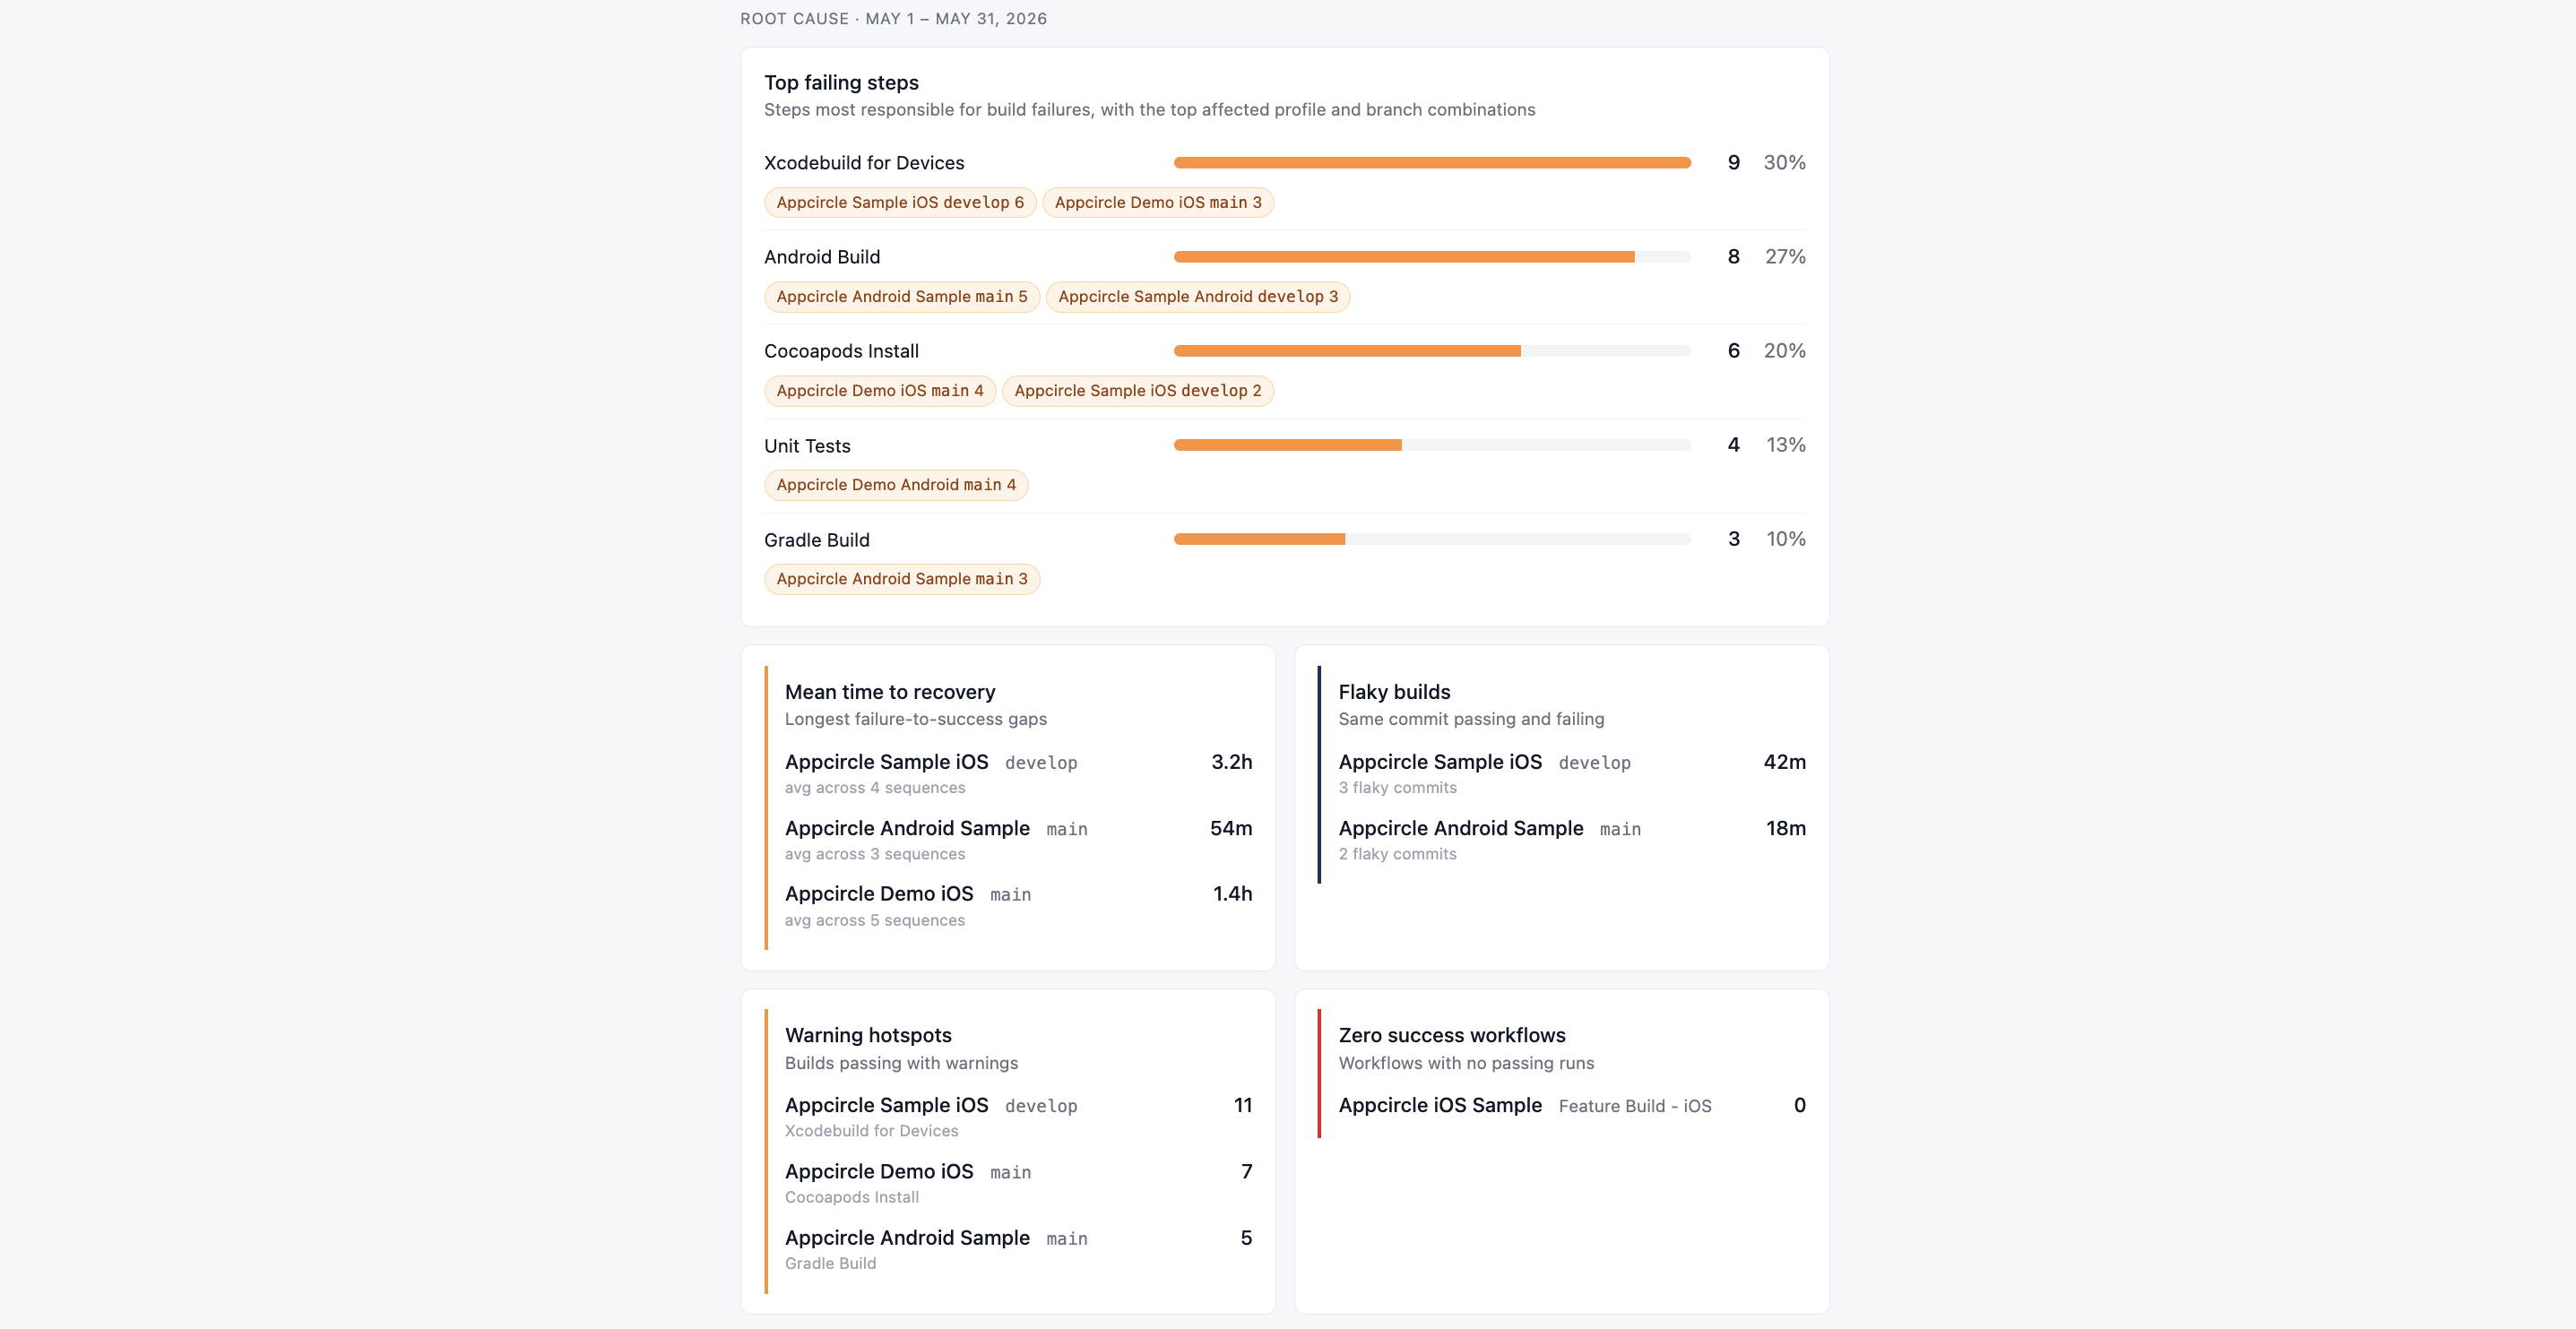
Root Cause
Failure analysis for the period:
- Top failing steps: the workflow steps most responsible for failures, with the profile and branch combinations they failed on most.
- Mean time to recovery: the longest failure-to-success gaps, by profile and branch.
- Flaky builds: profiles and branches where the same commit produced both a pass and a fail, with an estimate of wasted build time.
- Warning hotspots: profiles and branches that repeatedly pass with warnings, and which step triggers them most.
- Zero success workflows: workflows that had runs in the period but never passed, with the step that always failed.
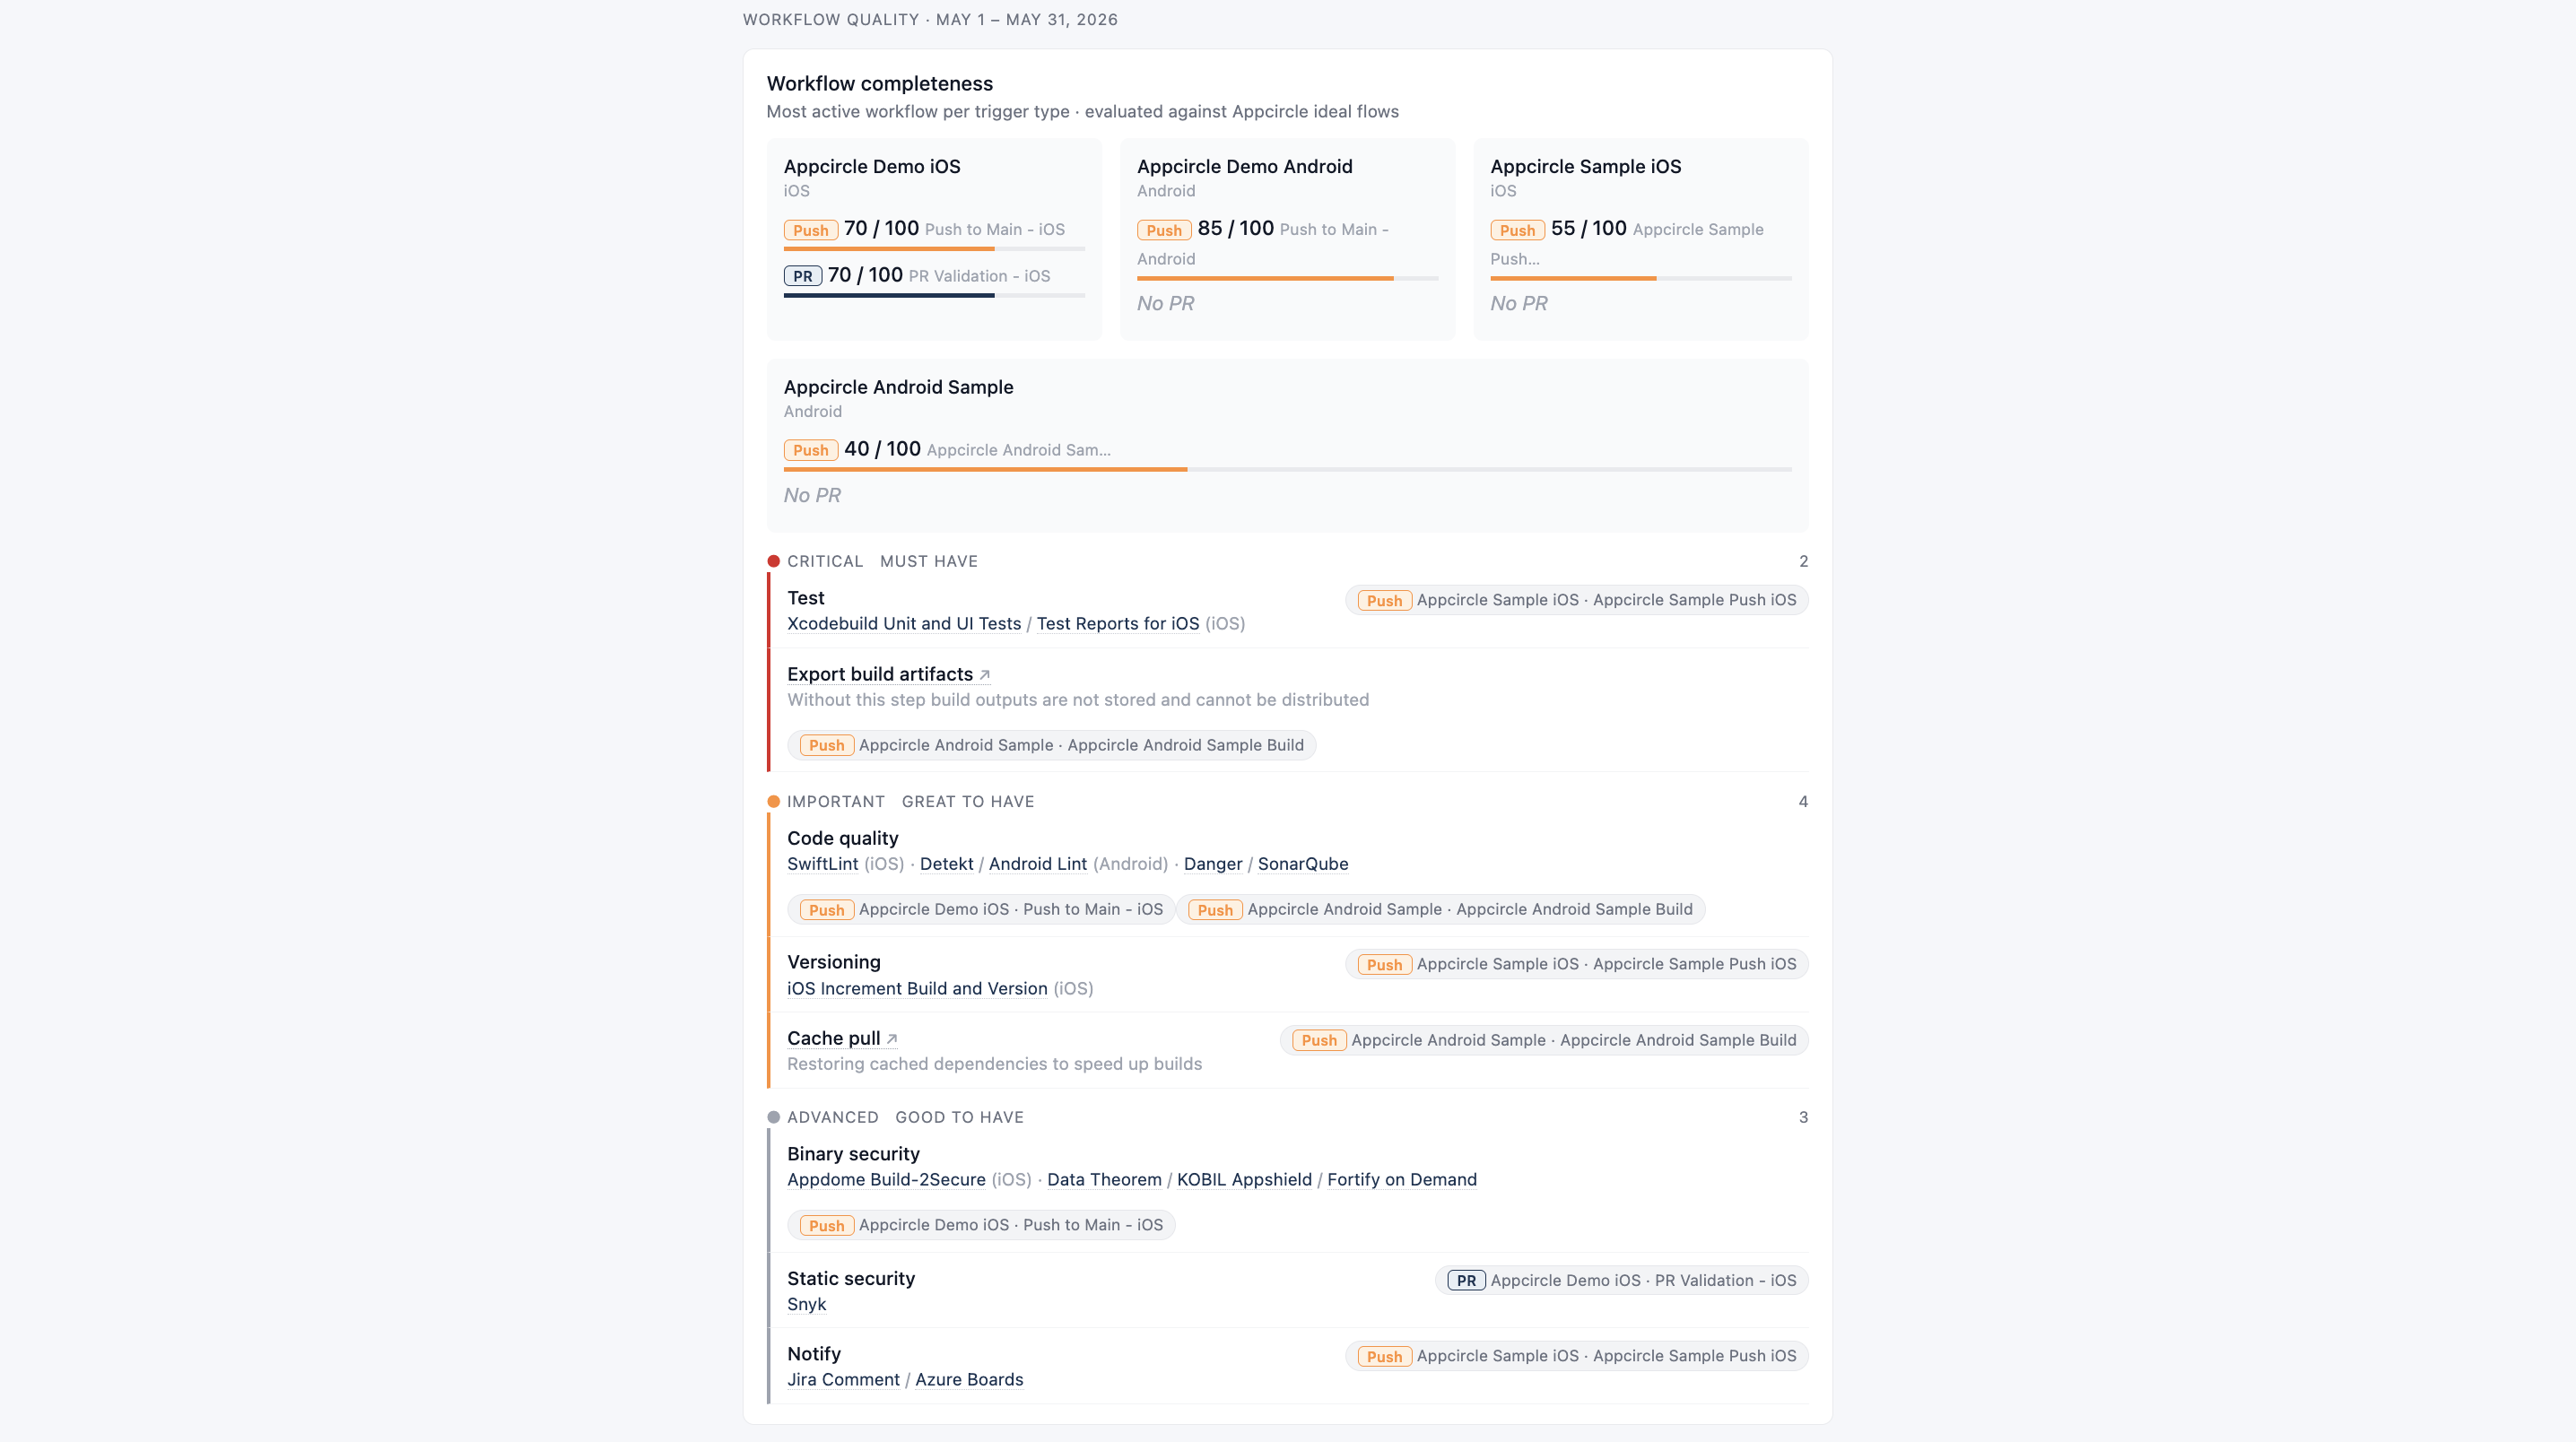
Workflow Quality
How well each profile's workflows match Appcircle's recommended flow:
- A completeness score (0-100) for the most active Push workflow and the most active PR workflow per profile, with the workflow name. A profile with no Push or PR workflow configured shows that state explicitly rather than a zero score.
- A tiered breakdown of missing steps across all evaluated workflows, grouped as Critical (must have), Important (great to have), and Advanced (good to have), each linking out to the relevant Appcircle workflow step documentation.
- Best practice checks: configuration issues found across active profiles, such as custom scripts not sourced from Git, missing PR workflows, or versioning that is not automated.
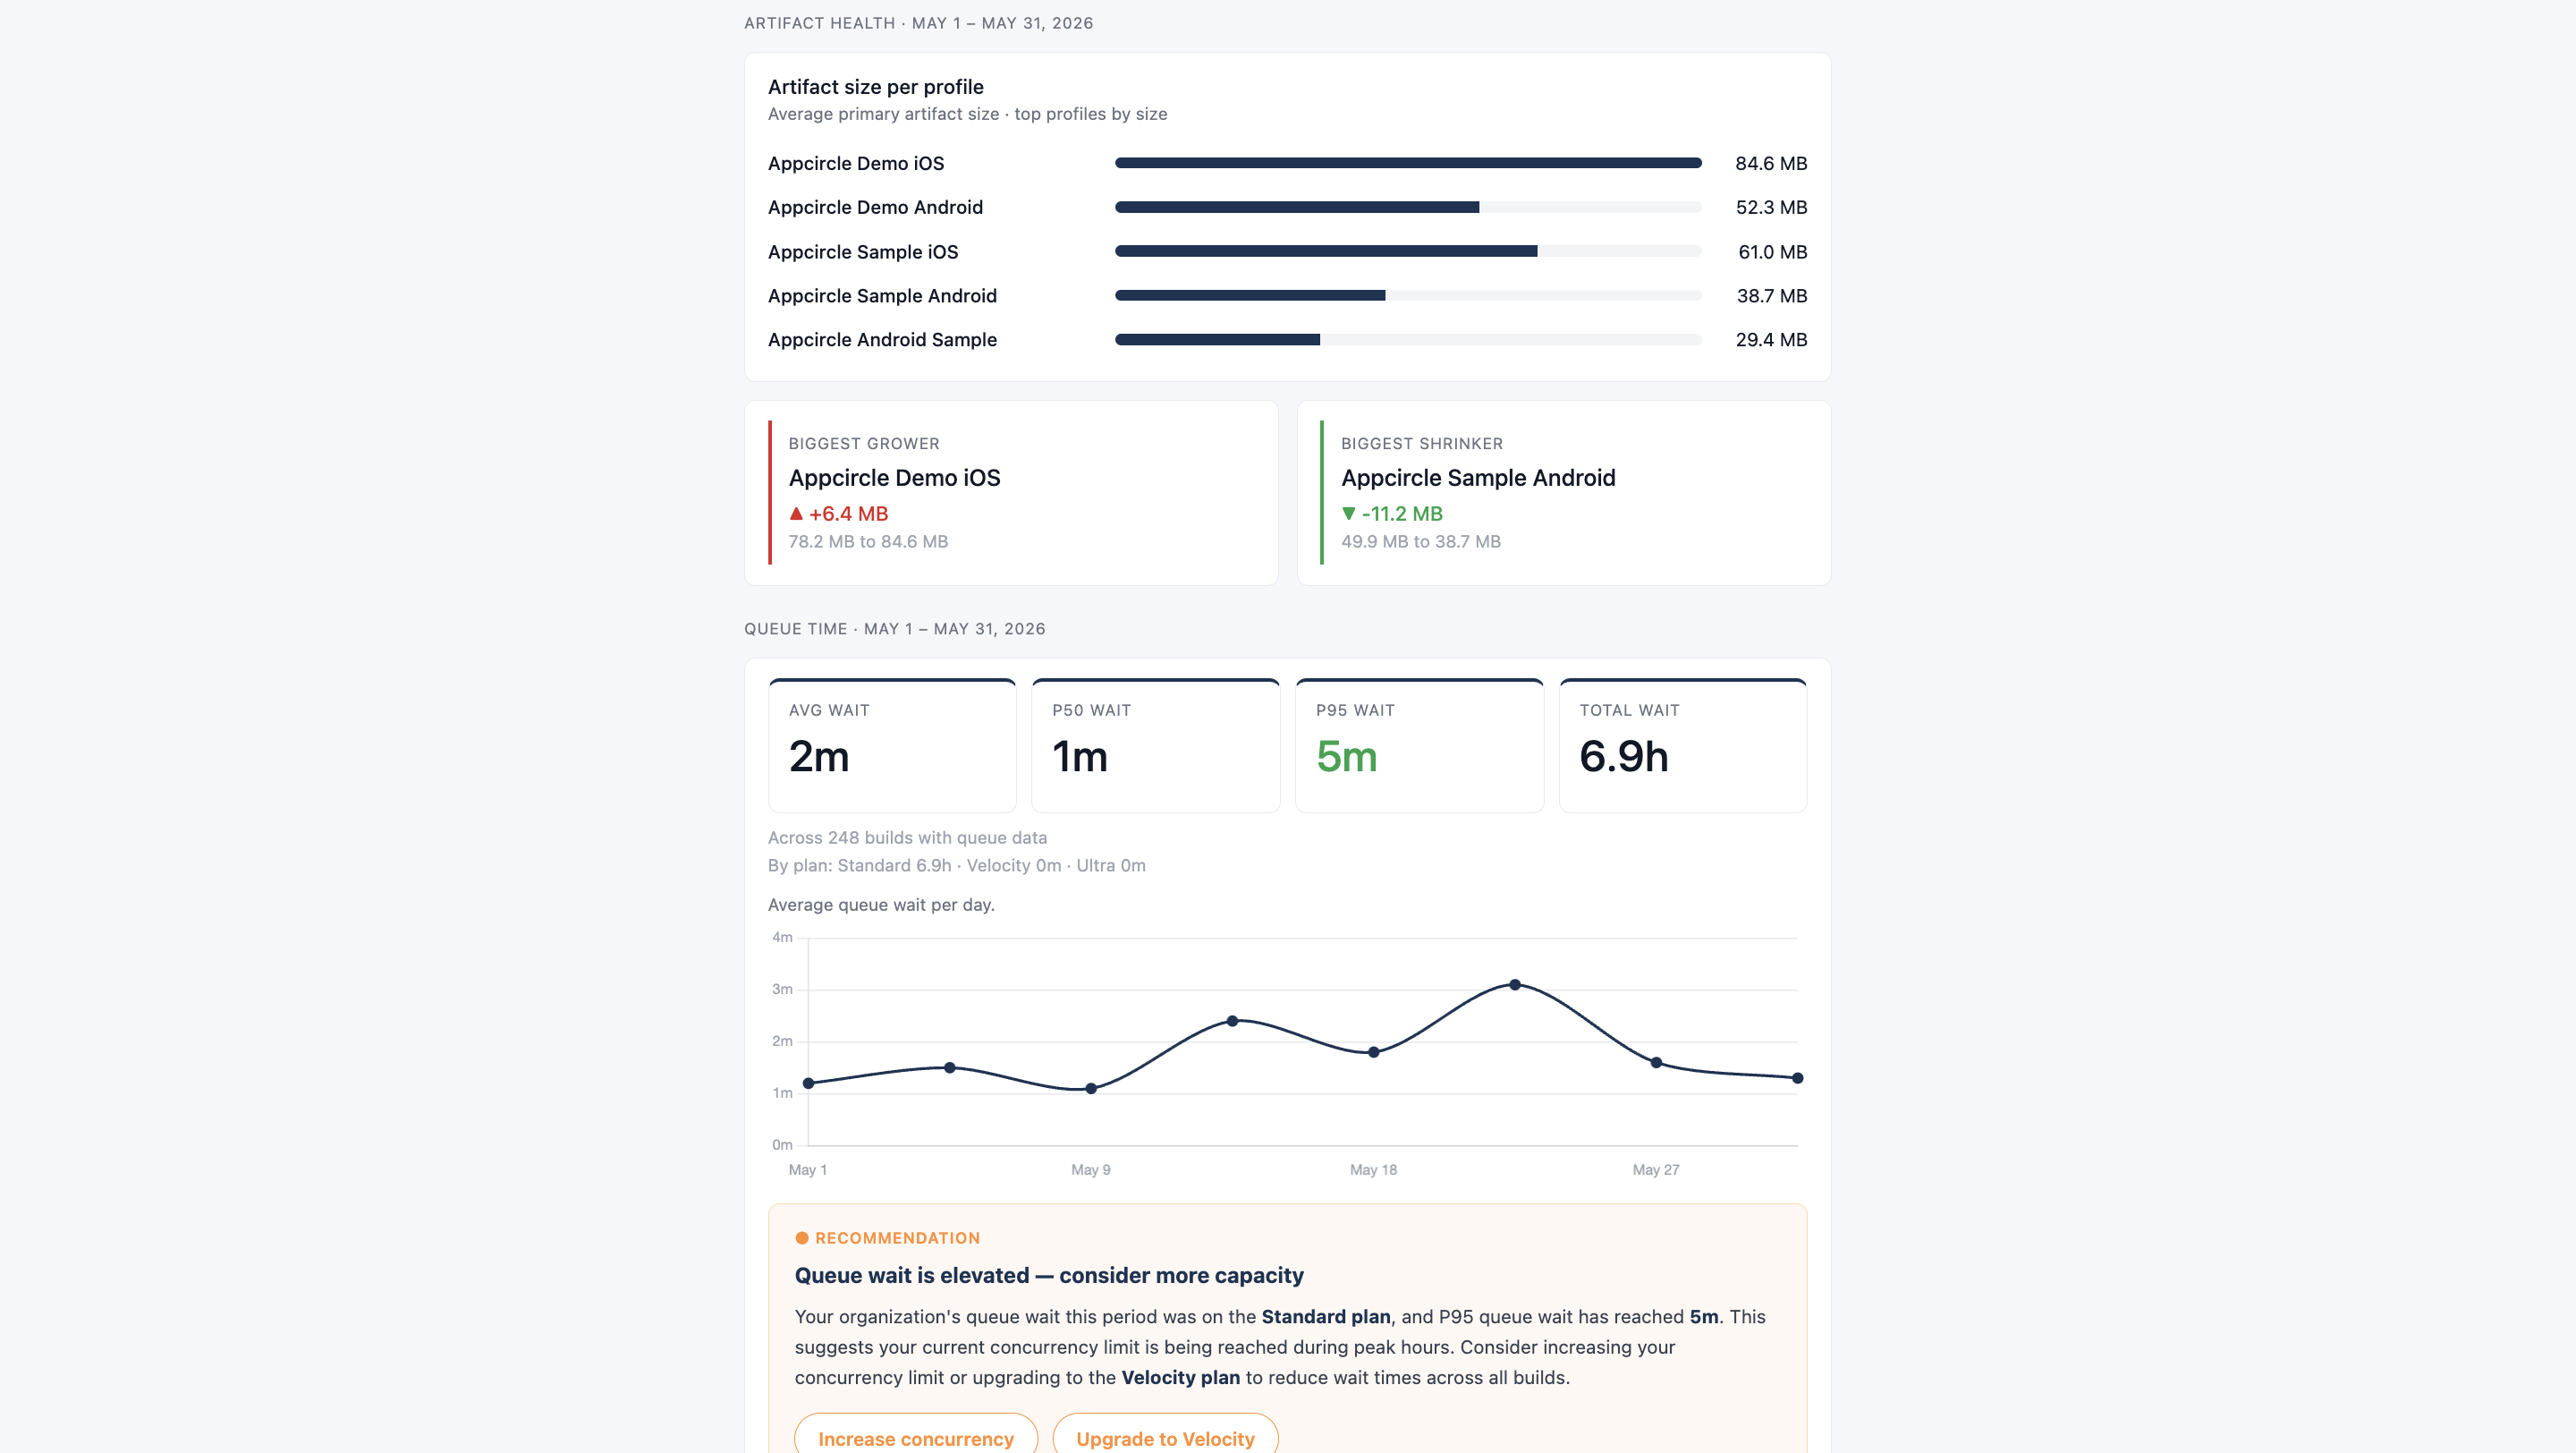
Artifact Health
- Average primary artifact size per profile for the period, as a ranked bar chart.
- Call-outs for the profile whose artifact grew the most and the one that shrank the most compared to the previous period (when a previous-period baseline exists).
Queue Time
How long builds waited before starting, tree-wide for the period:
- Average, P50, P95, and total wait time, across however many builds had queue data.
- A daily trend of average wait time.
- When wait times are elevated or trending up, a recommendation card that names which machine plan absorbed the most wait and suggests an upgrade path (Standard, Velocity, Ultra) or increasing concurrency.
FAQ
What's the Default Time Range?
The last 30 days, compared against the 30 days before that for deltas. Pass start_date and end_date to the tool to use a different window; the tool compares it against a preceding period of the same length.
Can I Get This Report Outside the Appcircle Claude or Copilot Assistant?
Yes, for the underlying data. Any MCP client can call get_build_insights_report and get the same metrics as JSON. The visual HTML report rendering shown on this page is produced by the build-insights-report skill, which is currently exclusive to the Appcircle Claude Assistant and Appcircle Copilot Assistant.
Why Is a Section Missing From My Report?
A section can be absent because there was not enough build activity to compute it for the requested period (for example, no builds, no queued builds, or no profiles with a comparable previous period), which is not an error and not a zero value. It can also be absent because your access token lacks the required permission for the data that section depends on. Generating the full report requires a token with at least the Manager role. Check your token's role permissions if a section you expect to see is consistently absent.
Does the Report Include Builds From Sub-Organizations?
Only if you set include_sub_orgs to true when calling the tool. It defaults to false.
Why Might Workflow Quality Section Be Missing?
Workflow Quality is computed from profiles that have at least one Push or PR trigger configured. If no profiles in the organization have Push or PR triggers set up, the section is omitted from the report.